
Fluorochem came out with results today with good growth y on y and flat (marginally negative) on q on q basis. Management has explained subdued demand due to winter in European geography.
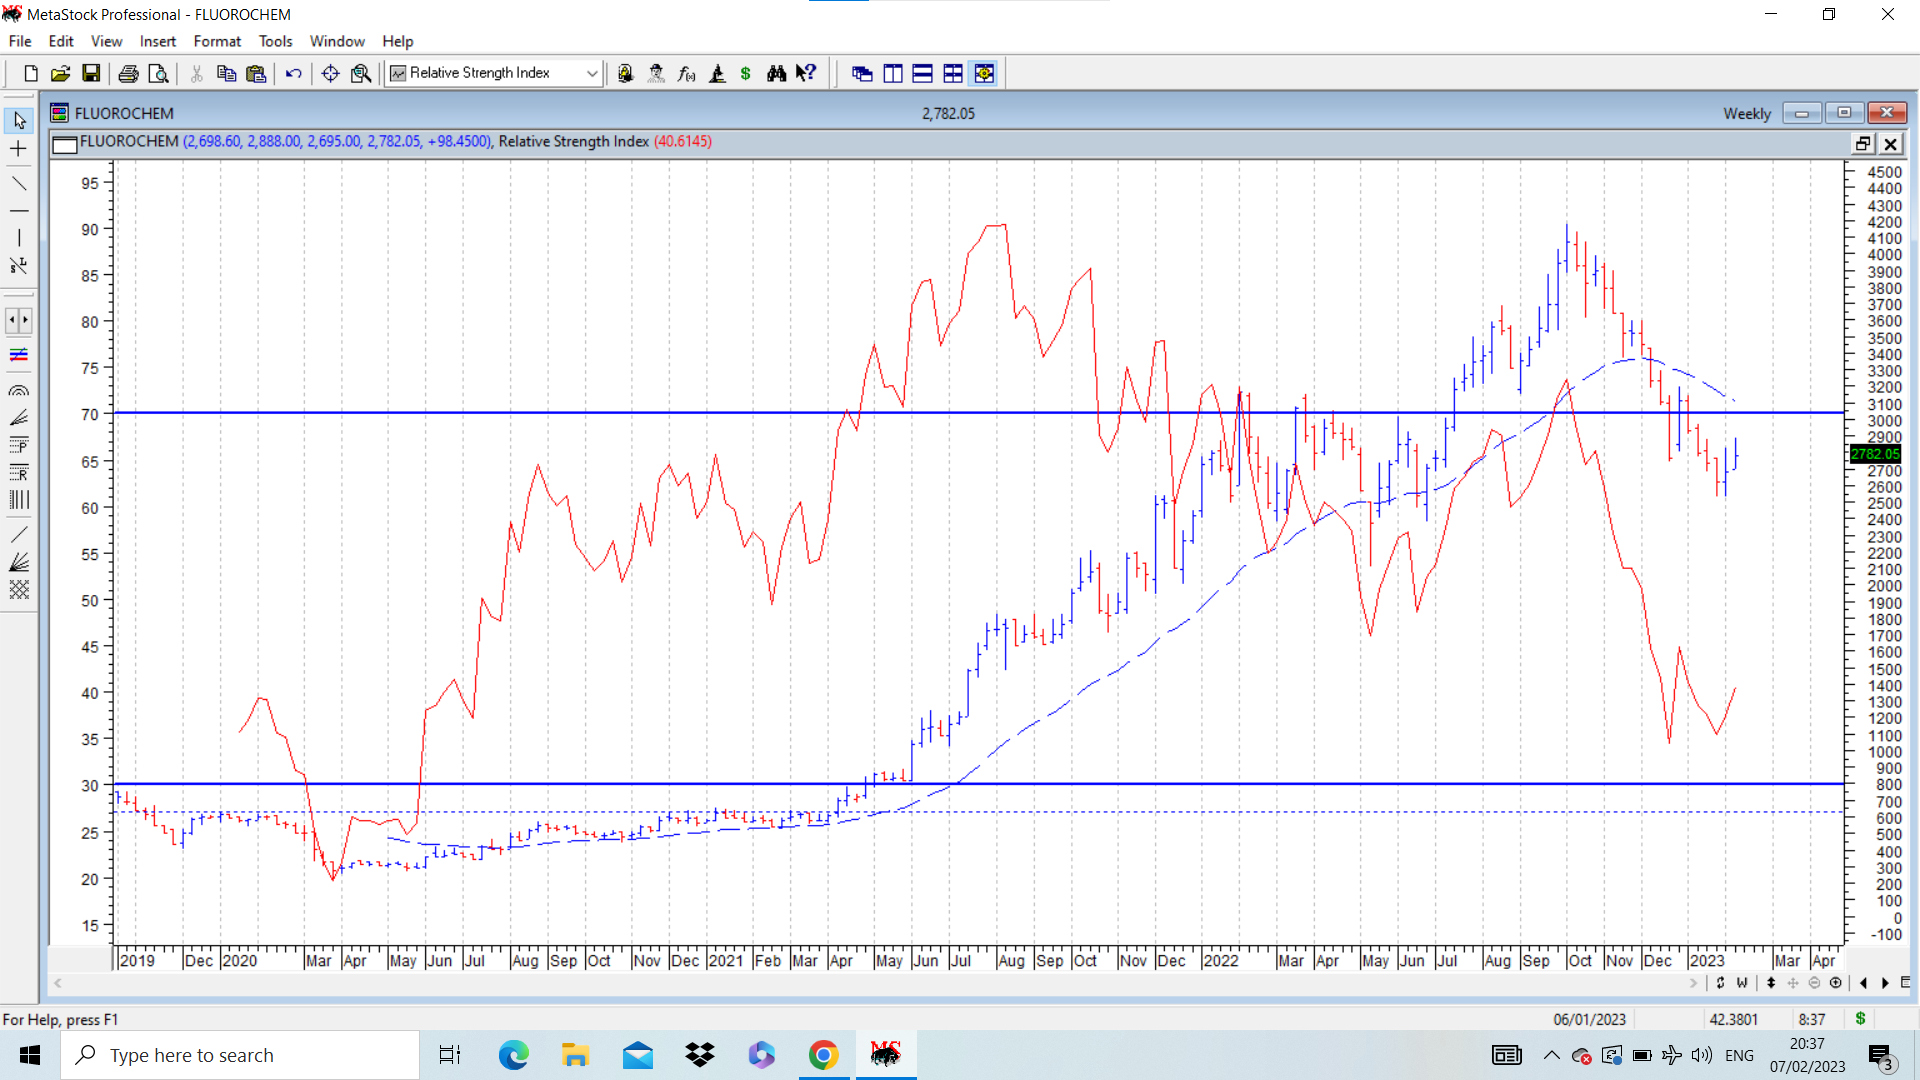
Fluorochem weekly chart. negative is stock price is well below 30 WEMA at 3115 and the avg is pointing down. Positive is the positive divergence seen in charts on RSI… When bottom of 2740 was made in Dec 22, RSI was 34.54. Recent bottom was made at 2534, lower than earlier low, but recent RSI was 35.45 which is higher than earlier RSI bottom. This positive divergence on weekly chart is often (though not always) an early indication of a bottom formation. And when this happens at levels that are important in terms of retracement, support ( usually previous zones of consolidation), then it assumes significance. For trend followers, it makes sense to buy once stock goes above 30 WEMA and the moving avg also turns up. For those who know their company and are confident about fundamentals for next few quarters and are ready to bear range bound moves in the stock price, current price or lower with stop loss of 2534 may be good enough to take/accumulate position. Though they might need patience. disc: invested as disclosed before.
| Subscribe To Our Free Newsletter |
