
Thanks for checking.
To answer your question, first we need to tell something about MACD cycles.
On top of our charts, you will always find MACD. It can help in finding the direction. But keep in mind that signals on weekly/monthly take time to play out.
Now let’s have a look at the PolyCab
First let’s have a bigger picture.
On monthly chart, MACD gave sell signal in Jan 22 and we had a one year long correction ,sideways movement.
Now MACD is flat for last 3 months with little bias towards upside that indicates that stock might resume its upward journey. But this needs to be confirmed from shorter time-frames MACD ( weekly/daily)
Ideal situation is that MACD green line should come to zero line and then should move upwards but in many cases it does not happen and MACD moves up without touch the zero line. That means that it is not a fresh move but it a move that is balance from the previous -upward ( downward ) journey.
Monthly chart.
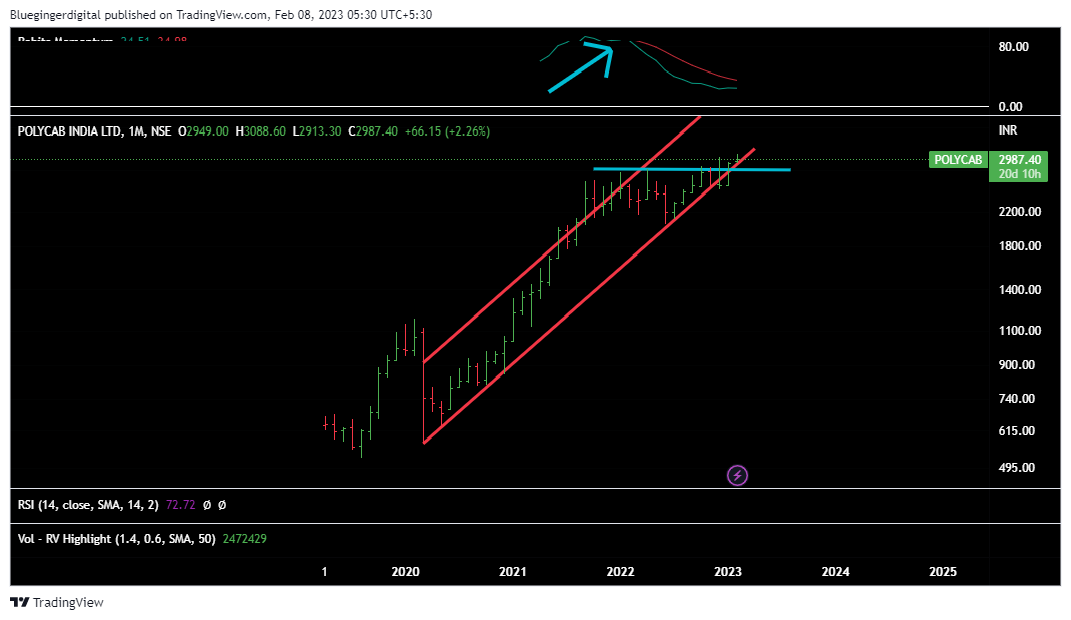
MACD gave a sell -signal In Jan 22 when price was near 2900 and stock corrected near to 2000 in coming month.
But keep in mint that weekly and monthly signals take time to play out.
Sometimes you might get a sell signal on MACD but stock -price keeps going up or keeps moving in a range.The pattern at that point is known as distribution pattern – that means that big hands are exiting but they don’t want the price to fall immediately as they want to sell their big quantity at higher levels only.
But the price won’t go far as the direction has been set. So sell/buy signals on weekly /monthly MACD should be taken as an alert and one can plan phased entry/exit based on other parameters (Stage Analysis or any other methods)
Now after we’ve looked at monthly chart for bigger picture, then we come to weekly chart for medium term signals.
Weekly Chart
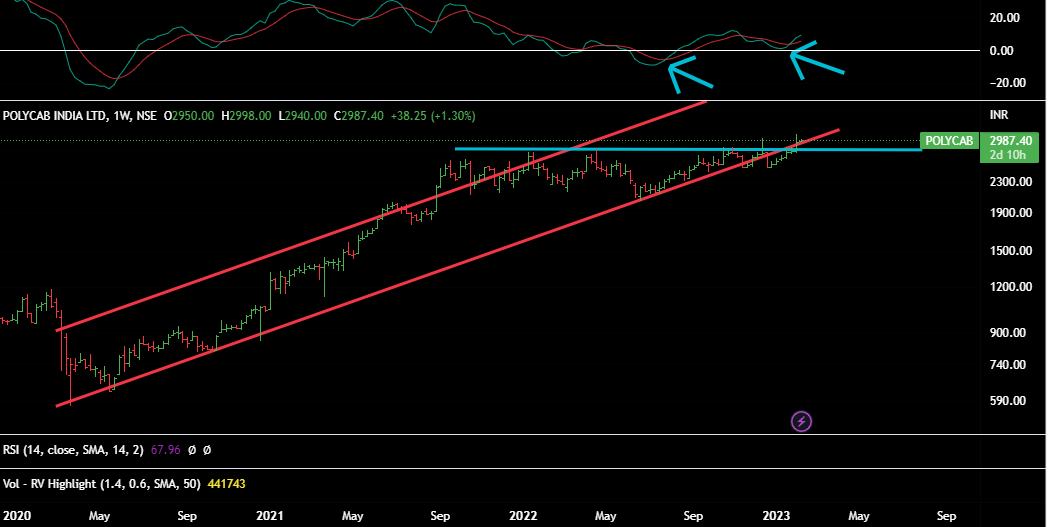
Here we get anothe confirmation on what montly MACD was trying to tell.
We can see that few weeks back we got a buy signal ( the first blue arrow), stock moved up and then we got the sell signal, it came to zero line completing one cycle ( correction of that leg) .
And now again we’ve a fresh buy signal and fresh upward move should start.
For more shorter term ,people use weekly/daily/hourly charts.
Hope this is helpful.
Would suggest to look at few charts of the past on daily basis – on all time frames and get a hold on how MACD indicator moves . Slowly -slowly one gets used to it.
| Subscribe To Our Free Newsletter |
