
First Source Solutions (FSL)
CMP 120
Many lessons here if you’re on the journey of learning technical analysis with us.
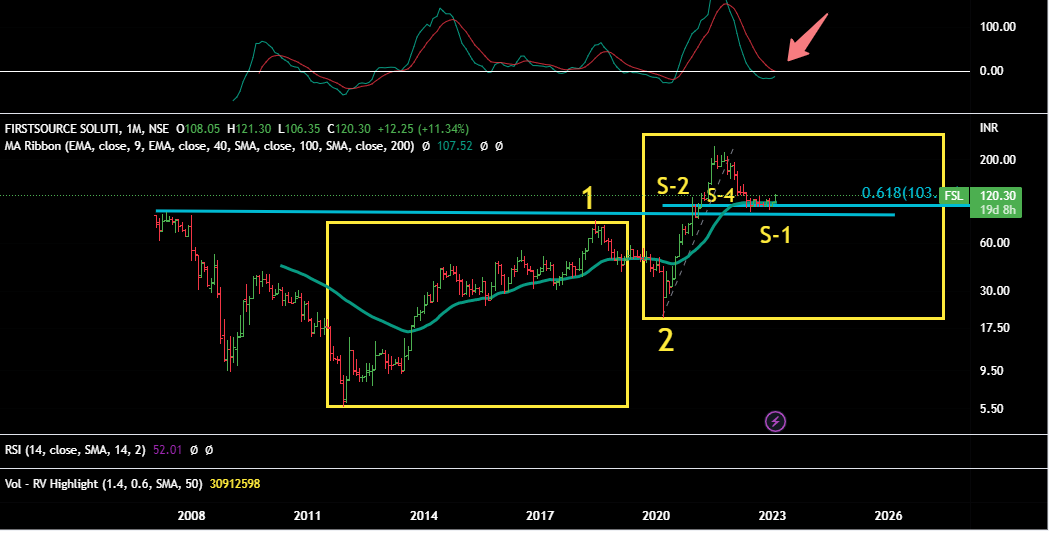
We start from monthly chart to get the big picture first.
Stock has corrected 61.8% of whole rise from March 2020. Took support at ATH levels of 2007 . And is making a base.
MACD has completed the sell cycle and now is turning upwards. Yet to give a complete buy signal.
Monthly Chart
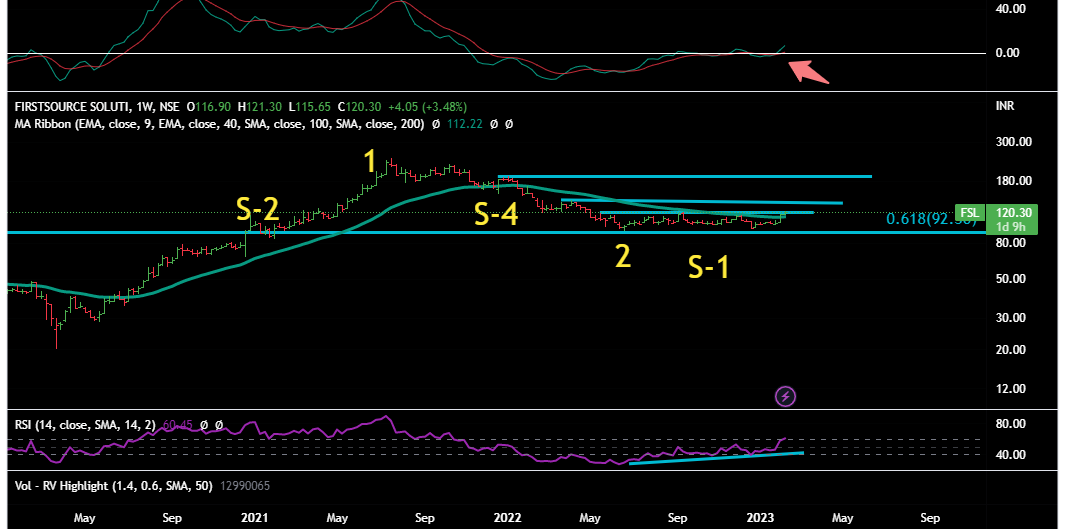
Weekly Chart
Price has moved above 40 WEMA , has formed a base of Satge 1 for last 8-9 months.
MACD has given a buy signal.
RSI divergence is clearly visible on the charts.
Good volumes in last few days.
Stock has corssed the initial trading range – all these are early signs of starting a fresh Stage 2 (fresh wave)
But has lots of left-side resistances.- hence entries can be staggered on the basis of crossing these resistances.
Daily Charts
In very short term, it seems that MACD is exxtended a bit, RSI is overheated.It can correct a bit- it may come back to re-test the breaking point of trading-range ( a normal behaviour)
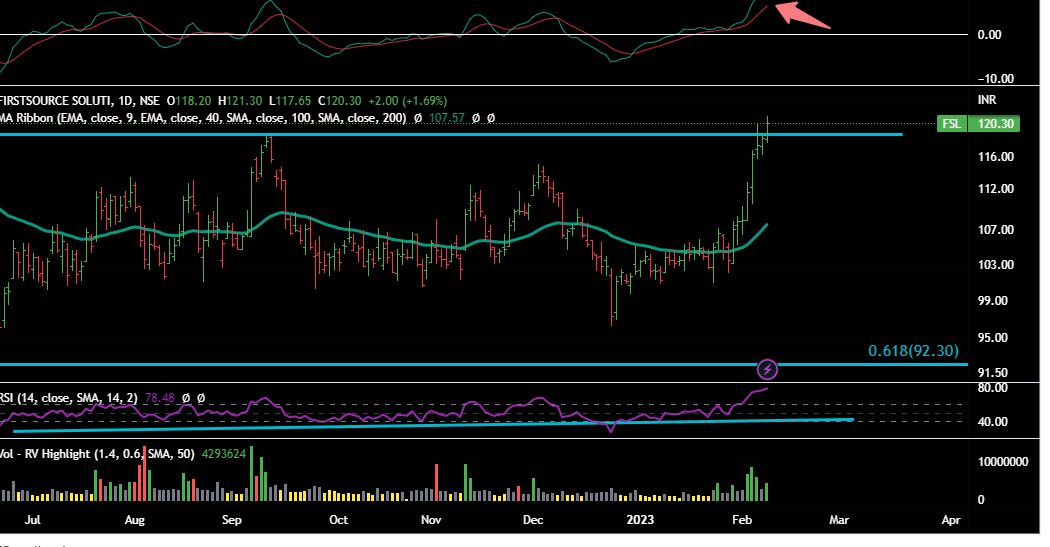
In short – this stock can be kept in watchlist , let it come back to retest the break-out levels and if it goes up again , one can start making the staggered entries based on crossing of dofferent trading -ranges.
Disclaimer :This post is just for learning few methods of price-patterns. Views are personal. No buy/sell recommendations. These are probability study methods and chances of success/failure depend upon various factors.
| Subscribe To Our Free Newsletter |
