
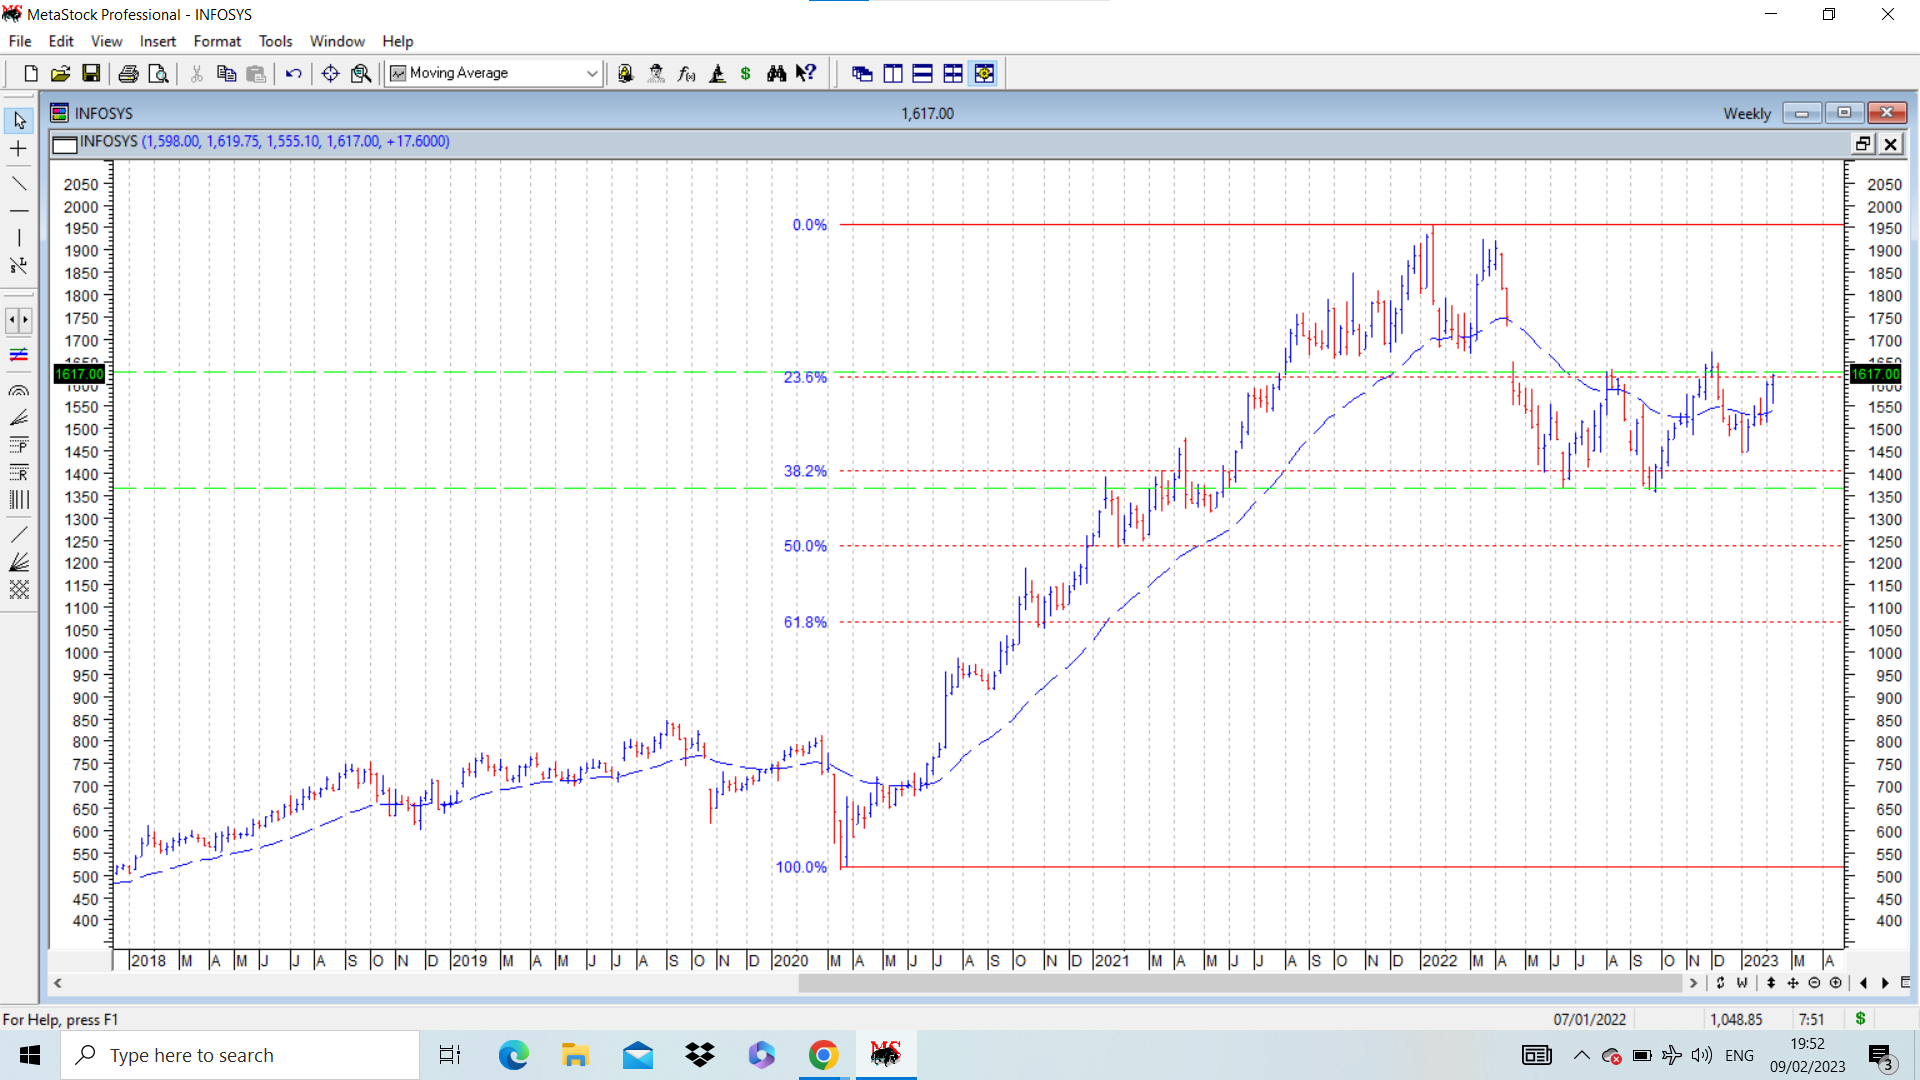
Putting up weekly chart of INFY. It comes across as one of the strongest stocks in large cap IT pack mainly because it corrected the least in the IT meltdown seen in past few months. It retraced only 38.2% of its entire rise from 510 in March 2020 to 1950 in Jan 2022, a rally lasting nearly 22 months. It posted a double bottom at 1350-60 levels and confirmation of this double bottom break out will come once it gets above 1625-30 and stays or moves above that. Double bottom in chart is marked by dotted green lines. Dotted red lines represent retracement levels. Dotted blue line represents 30 week moving average which has now flattened after remaining declining during the correction.
Near term resistance can be expected between 1727 to 1650 which is the area of a weekly falling gap.
Double bottom breakout target is 1885. All time high posted during previous major rally is 1950. These are key levels to watch. disc: no positions, but in watchlist.
| Subscribe To Our Free Newsletter |
