
CSB Bank
CMP -231
First of all ,let’s clarify that there’s nothink known as Stage V in Satge Analysis.
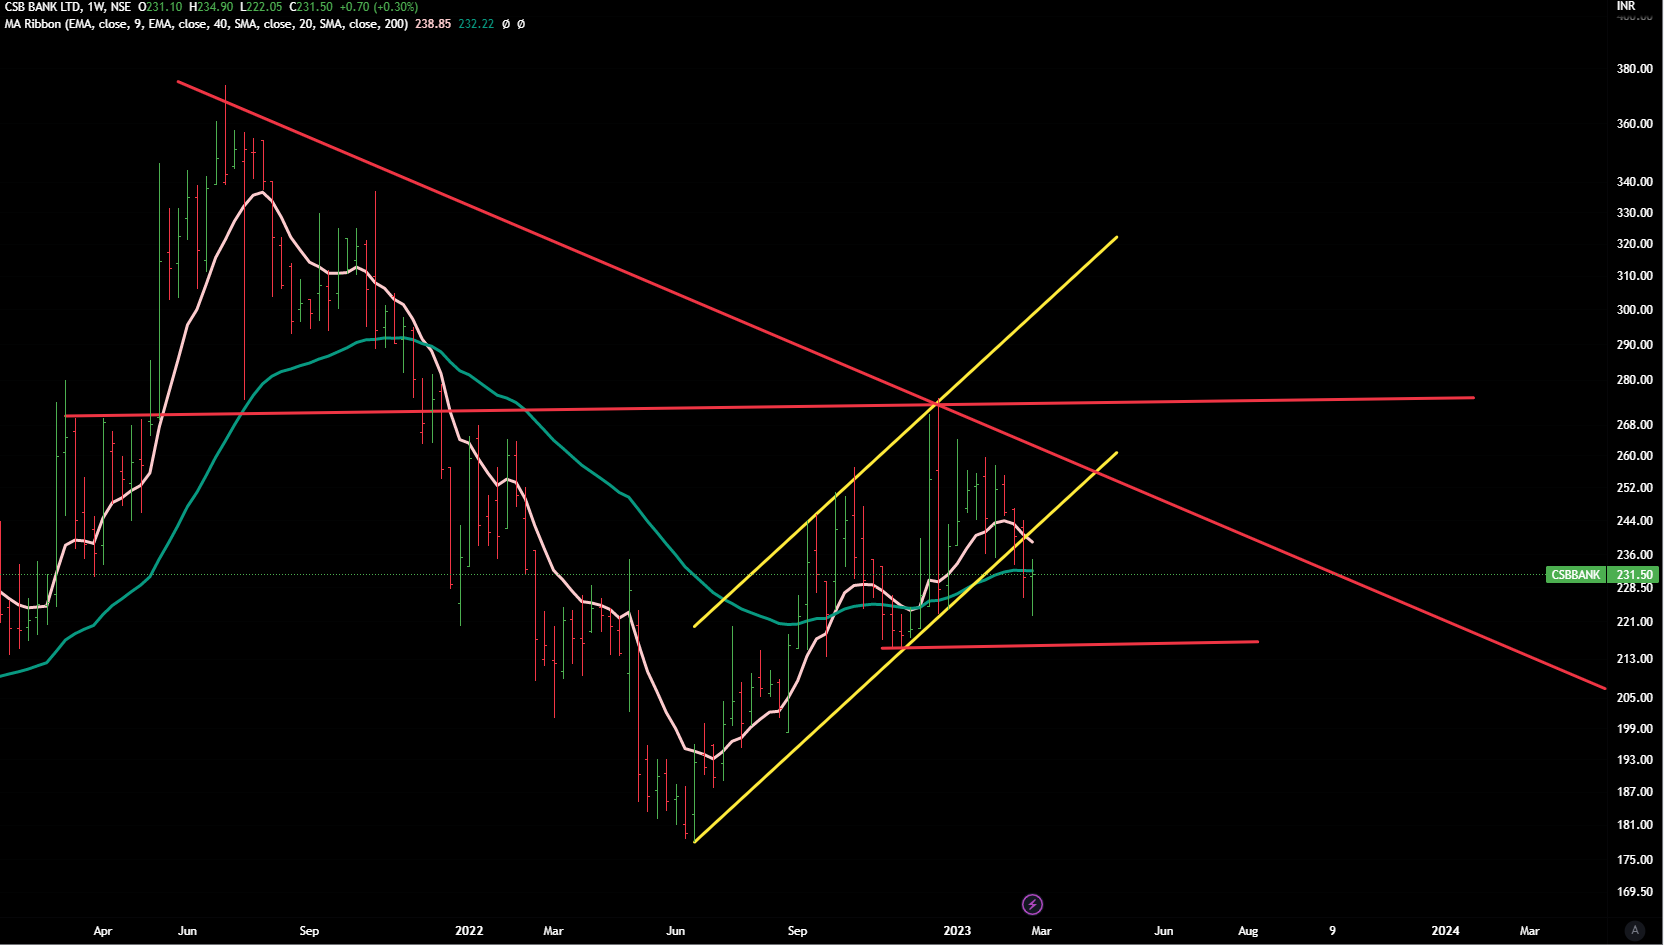
As far as CSB is concerned, it does not very promising. It is still below 40 WEMA .
It has broken the rising channel ( drawn from June 21 lows).
Red lines on the chart show imprtant support and resistance areas ( on lower side 215 is the support and on upside 265 -275 is the resistance zone) . If the stock starts closing beyond these levels for few weeks (with volumes) , it would move in that direction.
Weekly Chart
Disclaimer – Not invested.
This post is just an effort for learning few methods of price-patterns. Views are personal. No buy/sell recommendations. These are probability study methods and chances of success/failure depend upon various factors
| Subscribe To Our Free Newsletter |
