
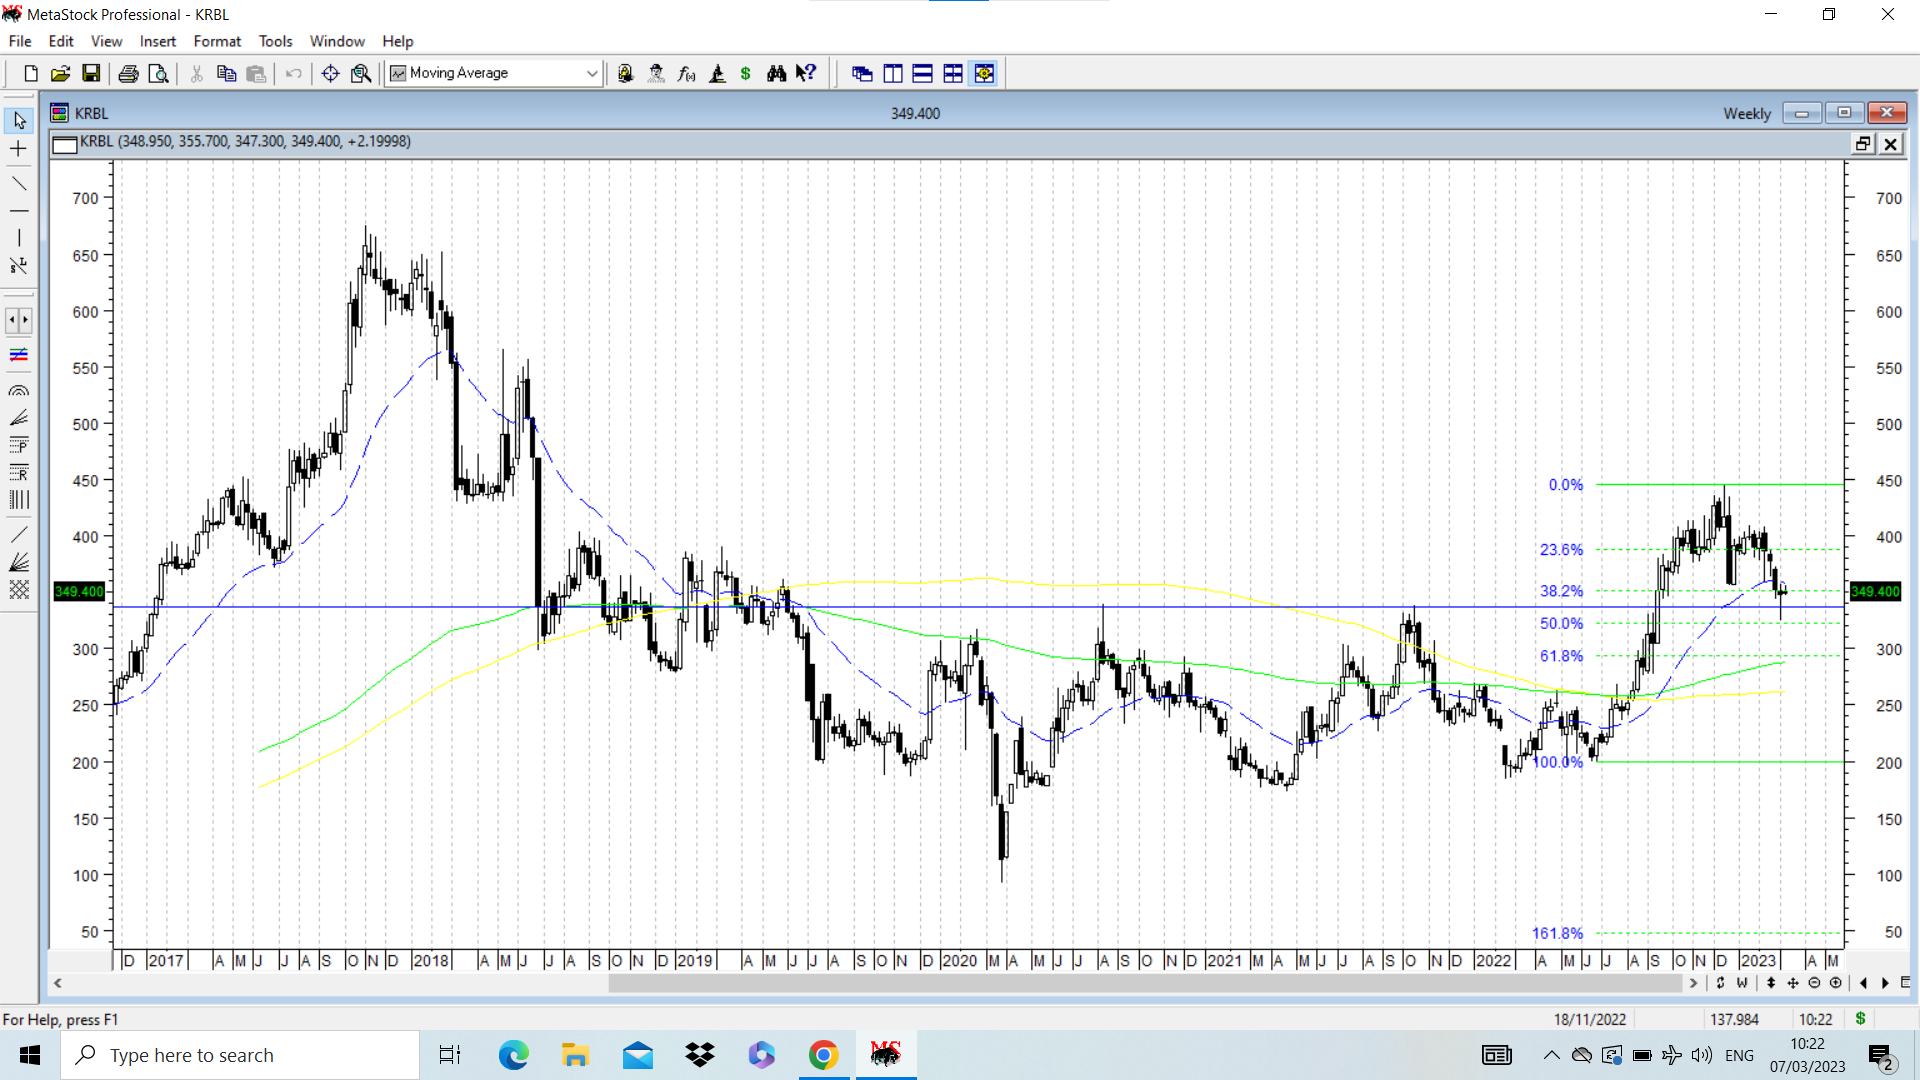
KRBL had a major 3 year breakout above 335-340 and then stock price went up to hit a swing high of 445 and then started correcting. It gave a negative divergence on weekly chart when it hit 445. Post that it started correcting and hit a swing low of 325, which is close to 50% retracement of previous rally and formed a hammer on weekly candlestick, which signifies a possibility ( though no surety) of a weekly bottom in place.
On weekly chart, it seems to be forming a rounding structure . which began from a high of 675 and a low of 92. Overall the structure seems good.
The current correction seems to be a routine correction to the previous rallly from lows of 198 to 445. It also provides a retest of previous major breakout levels of 335-340. Current market price is 349 and the all important 30 week Moving avg is at 360 and is flat. I would personally pefer to see the stock price go above 360, consolidate and then contemplate taking a position if at all I would pefer to buy it. I exited the stock earlier when it started giving negative divergence on weekly charts and there seemed to be weakness on price pattern on daily chart at that time.
Putting up the weekly chart below with 30 WEMA marked in dotted blue line, retracement levels marked in dotted green lines and breakout level of 337 marked in solid blue line. As of now I have no positions, but it remains in my watchlist.
This chart has been shared for academic purpose and is not any recommendation to buy/sell.
| Subscribe To Our Free Newsletter |
