
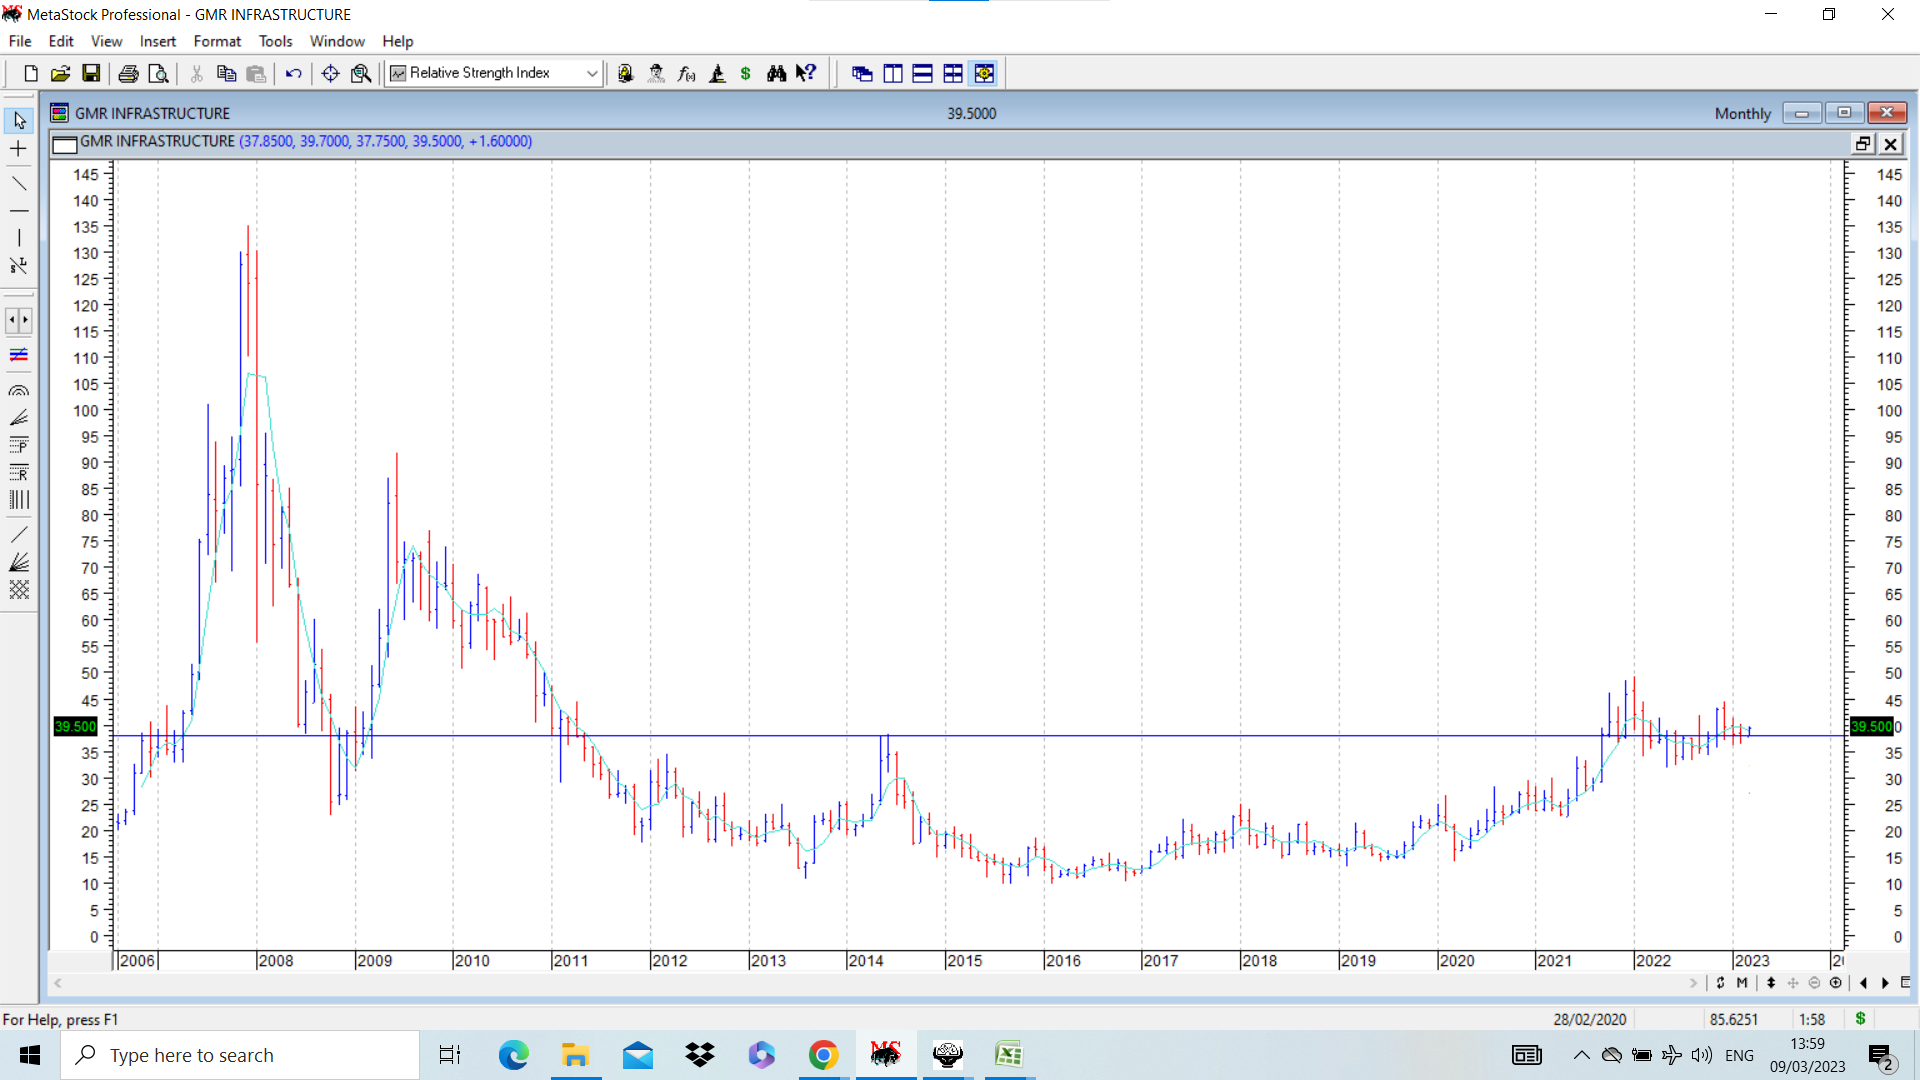
GMR had broken out of its 11-12 year highs above 38 and went up to 49 and then corrected and retraced down to 32, and currently is around 39. What is important here is that this is a pattern clearly visible on monthly charts and the last major peak was in 2009 at around 92, which is where the stock could be headed if the rounding structure keeps playing on. But for that it will take a lot of time as we are looking at a pattern on monthly charts. As mentioned before, price can fluctuate in a wide range, and one has to be able to digest these ups and downs. And then hope that the pattern plays out and targets are achieved. ![]() Putting up a monthly chart of GMR below.
Putting up a monthly chart of GMR below.
| Subscribe To Our Free Newsletter |
