
Here we go :
Likhita Infra
CMP -230
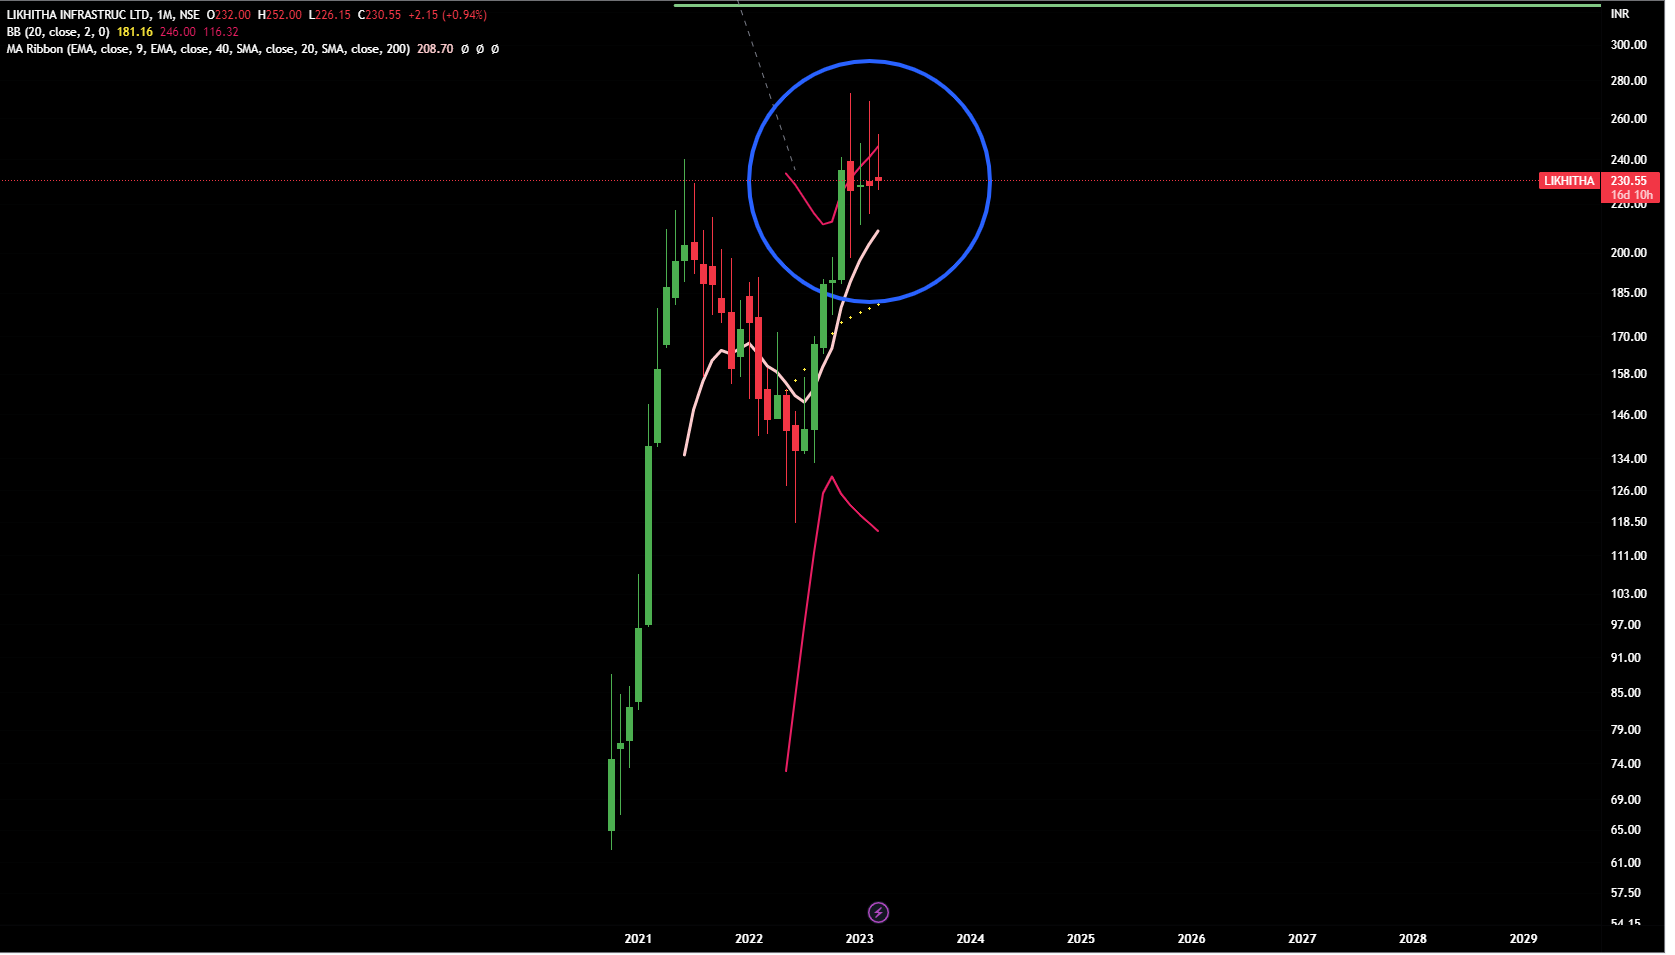
On monthly chart, we can see lot of candels with long upper wicks. That tells that there is lot of supply in upper zone. It should cross these levels with volumes if it has to go up.
Monthly Chart
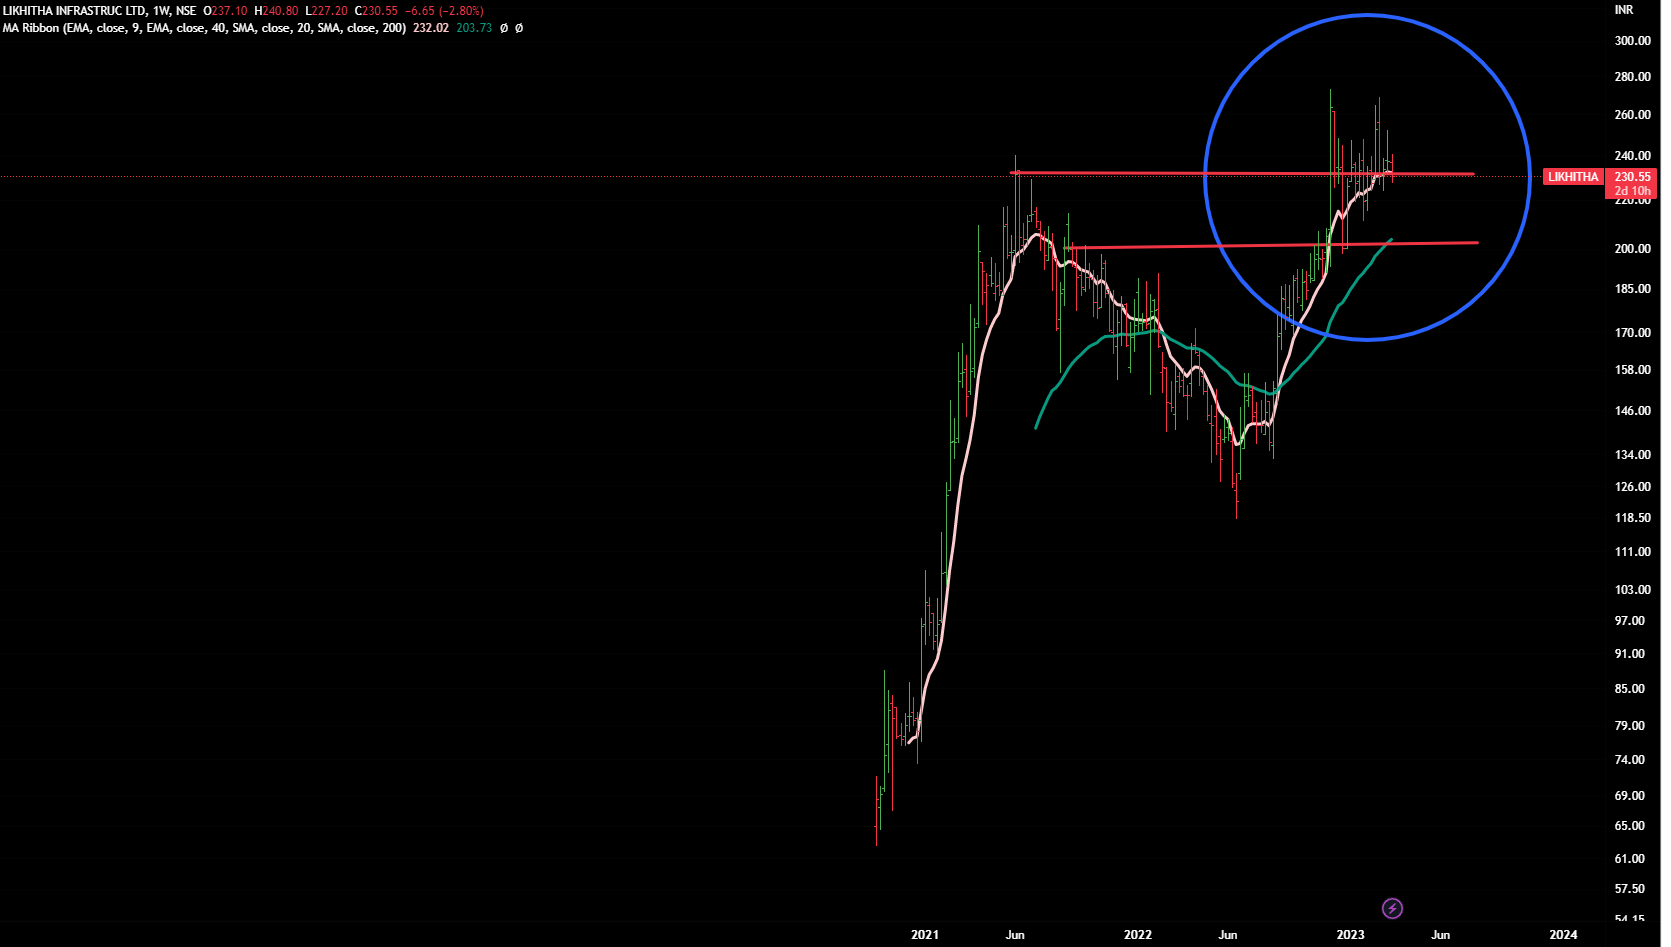
On weekly chart , it is showing weakness at a crucial level. Any weekend close below the upper red-line will take it near to 200- lower red-line .
Disclaimer :This post is just for learning few methods of price-patterns. Views are personal. No buy/sell recommendations. These are probability study methods and chances of success/failure depend upon various factors.
| Subscribe To Our Free Newsletter |
