
Stylam Industry
CMP 999
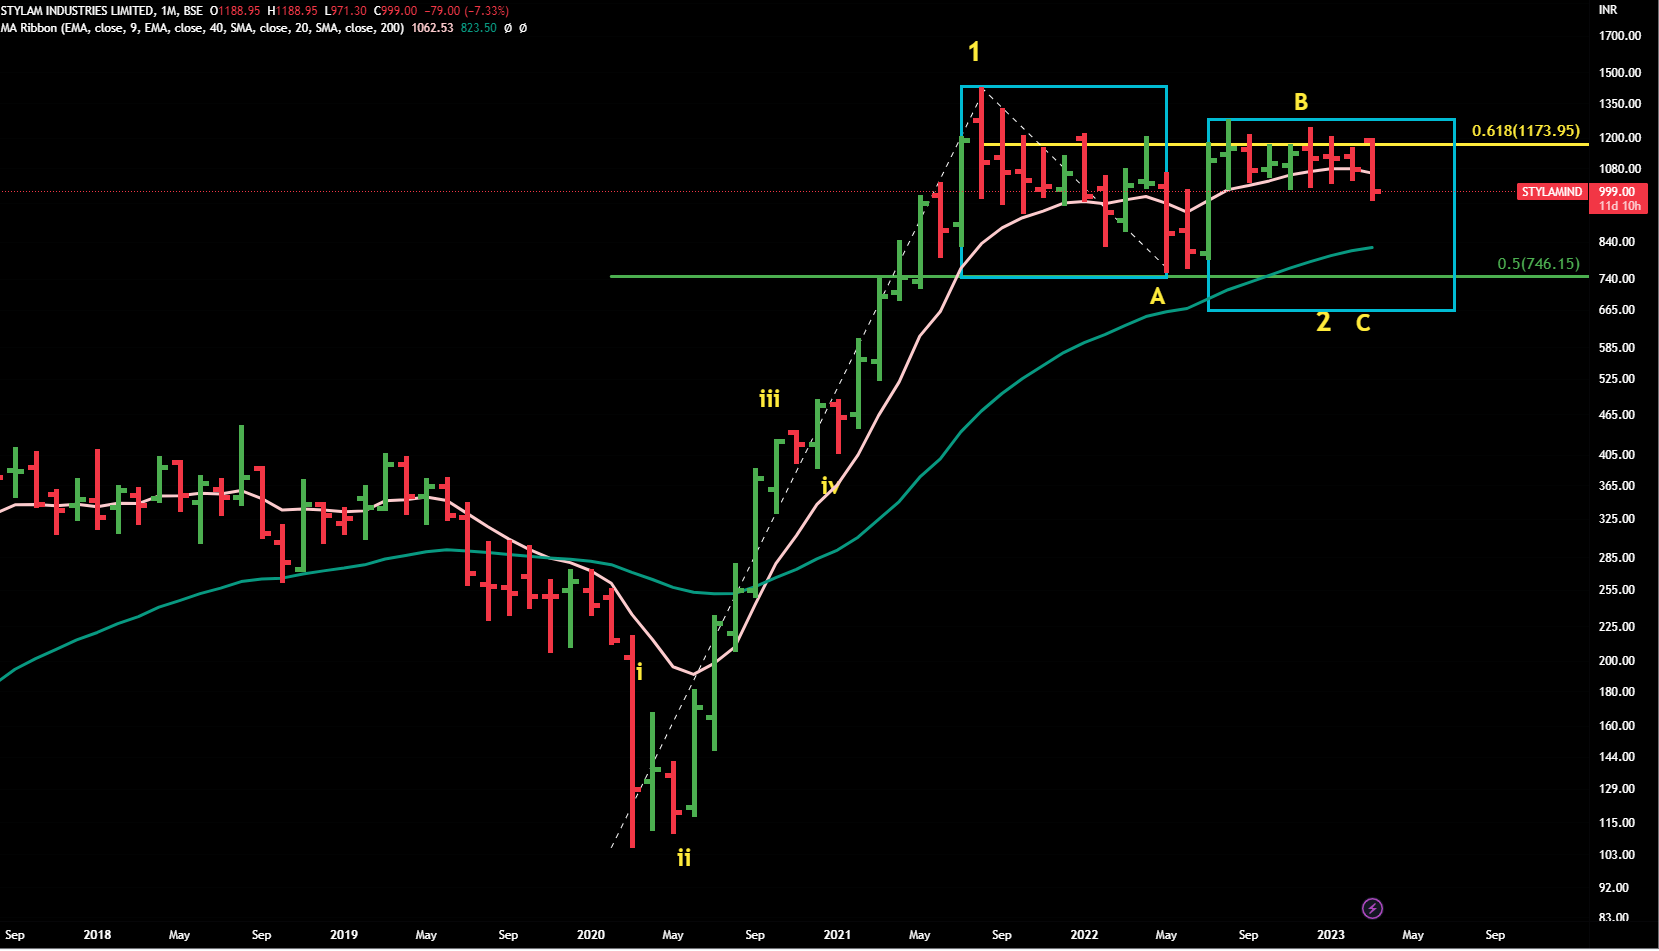
It seems that we’re still in bigger wave 2 ( stage 4 ) .
The stock corrected in wave A and bounced back but could not close above 61.8% Fib retracement of whole fall (upper yellow line). Hence we can assume that it was a wave B bounce and wave C is going on.
Monthly Chart
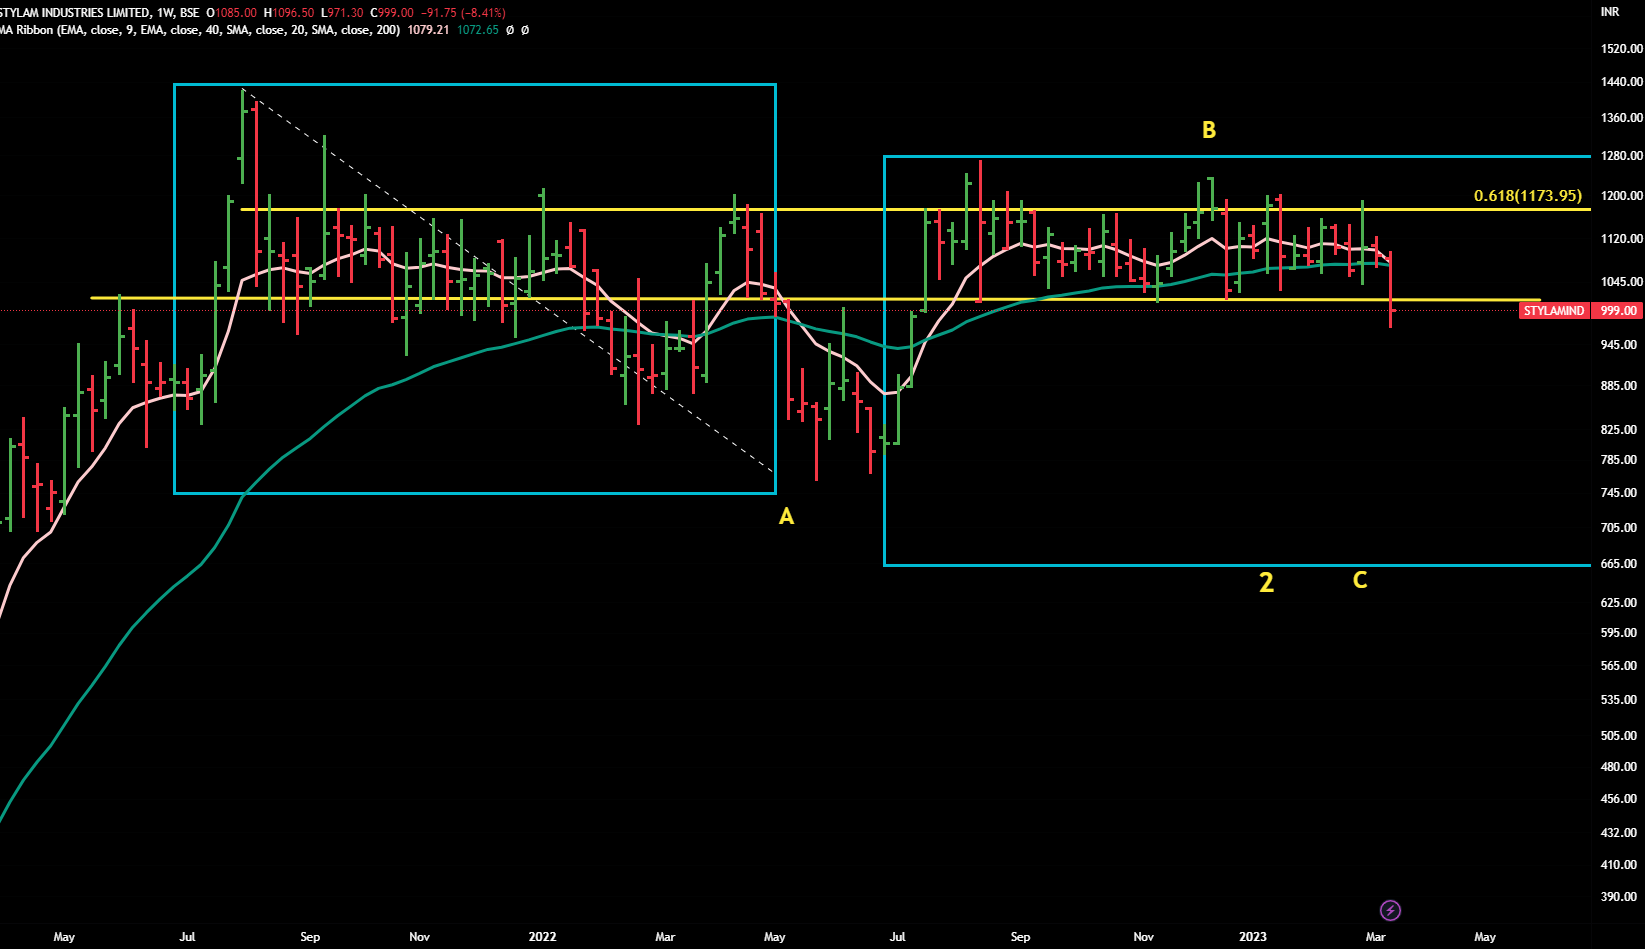
On weekly chart, it broke down the trading range of last few months (area beteen the yellow-lines) .Also 9 WEMA is crossing below the 40 WEMA. Hence as per stage analysis , we can assume that further correction is due in coming weeks/months.
For any sustainable upward move in short period , it should cross and close above the upper yellow-line in current set-up.
Weekly Chart
Disclaimer :This post is just a for learning few methods of price-patterns. Views are personal and are purely based on our limited knowledge of charts. No buy/sell recommendations. These are probability study methods and chances of success/failure depend upon various factors
| Subscribe To Our Free Newsletter |
