
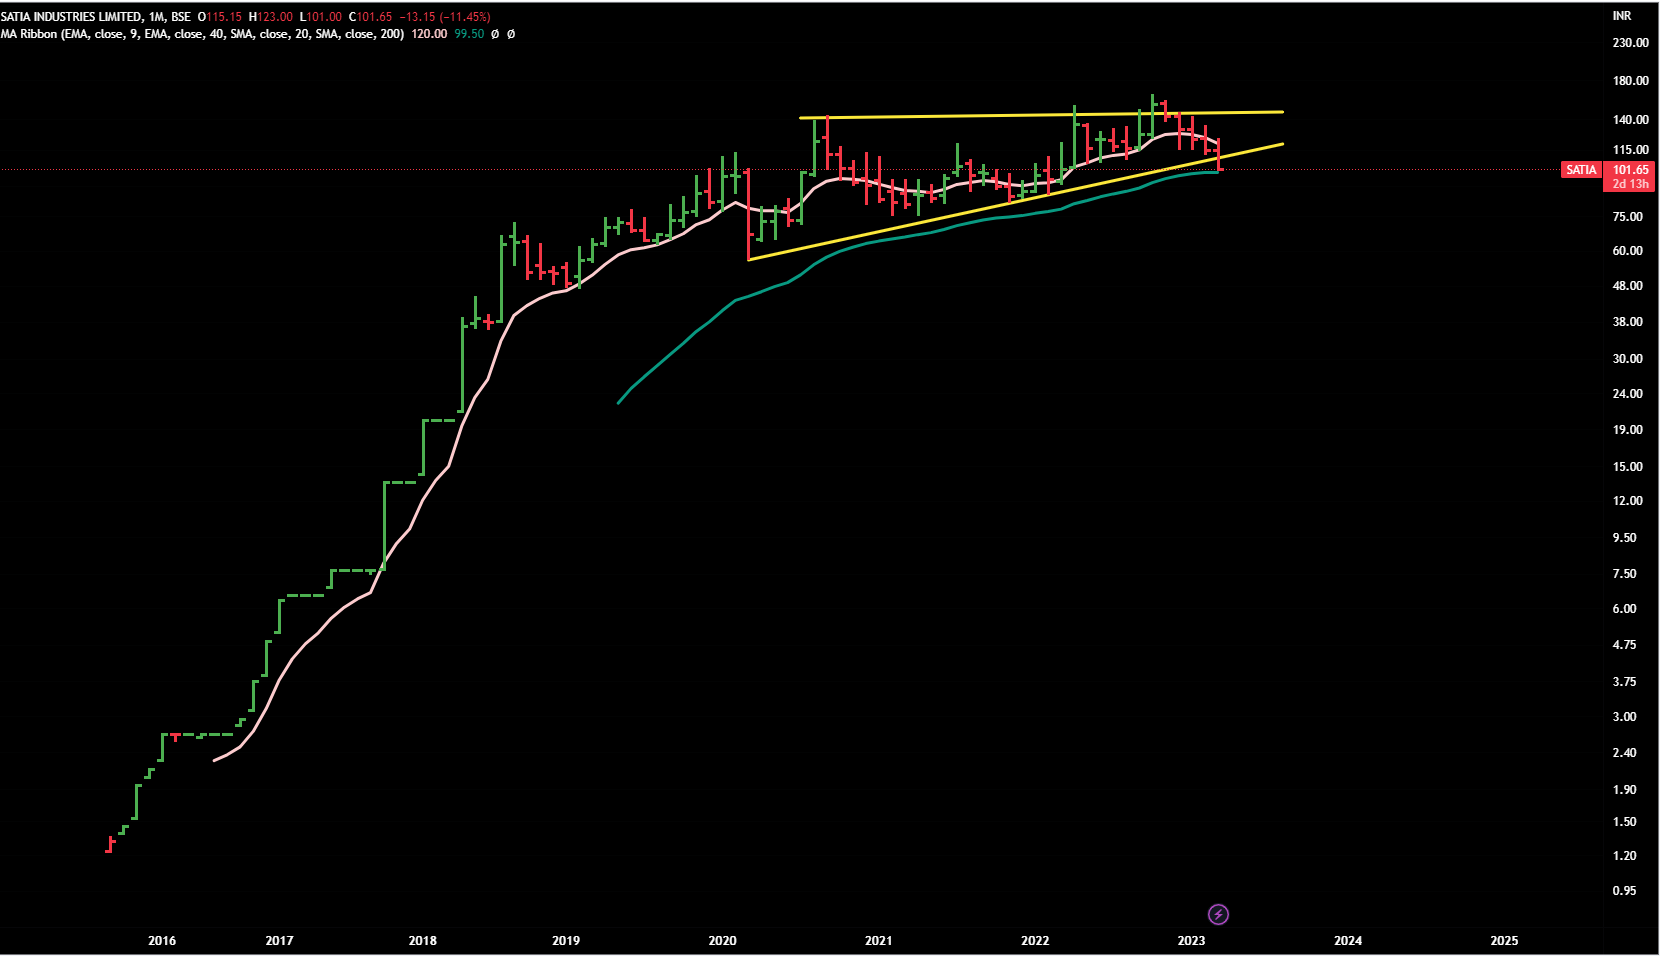
Satia
CMP 101
It shows a distribution pattern at the top and now it has given break-down .
Now 40 MEMA is the support zone (green line) …if it starts closing below it then next support-range is between 75-85.
Monthly Chart
Disclaimer : Invested and biased.This post is just a for learning few methods of price-patterns. Views are personal and are purely based on our limited knowledge of charts. No buy/sell recommendations. These are probability study methods and chances of success/failure depend upon various factors
| Subscribe To Our Free Newsletter |
