
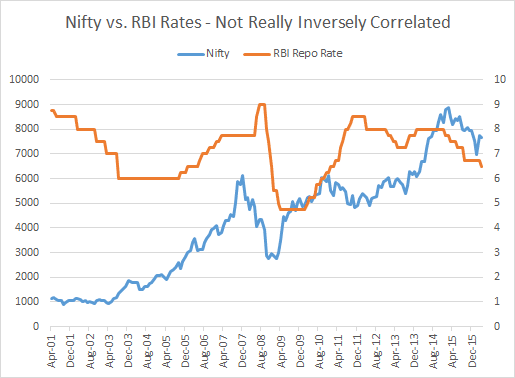
I do not have latest one but this graph is showing market bottom out when interest rates are halfway in the down cycle,
It can be seen in 2002 & 2008.
is this correlation right? or their is more to it like liquidity available in the system.
| Subscribe To Our Free Newsletter |
