
Nifty 50
April Start
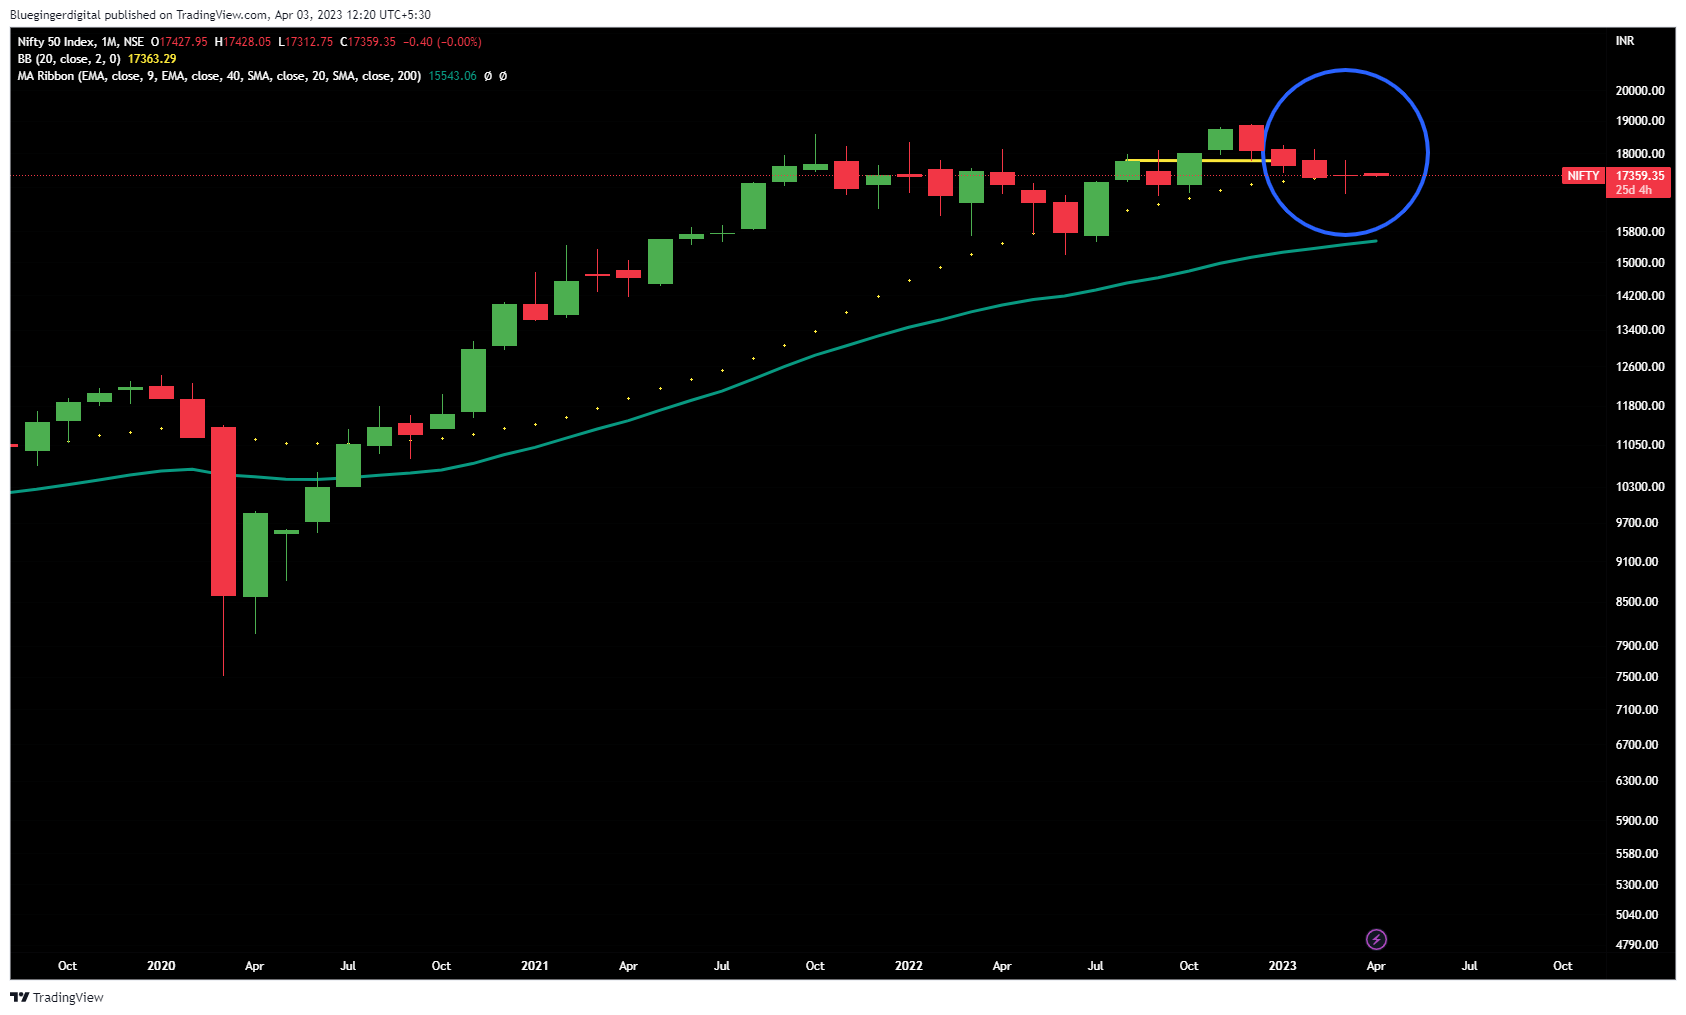
We made a long legged doji on Monthly Chart on March enc after 3 Black Crows formation during Dec-Feb period.
As per candle- stick pattern theory, this doji is a reversal pattern.
How long we would go in this leg…well that’s difficult to say but let’s keep tracking.
Similar pattern was formed in Nifty 500.
This would help in faster movement in the stocks where charts were already strong.
Disclaimer : This post is just an effort for learning few methods of price-patterns. Views are personal and are purely based on our limited knowledge of charts. No buy/sell recommendations. These are probability study methods and chances of success/failure depend upon various factors
| Subscribe To Our Free Newsletter |
