
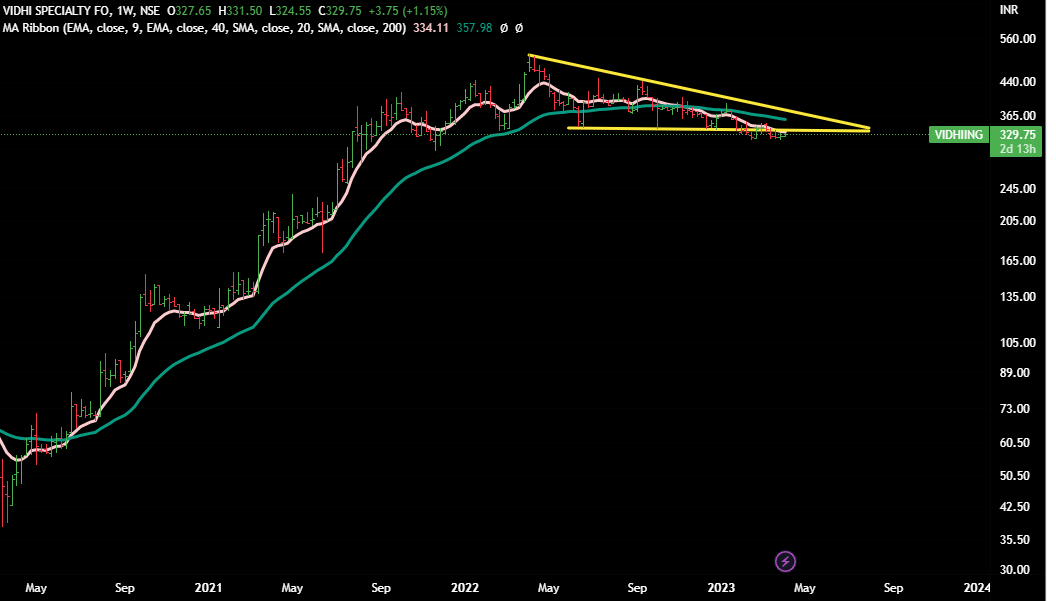
Vidhi Speciality
CMP 328
As of now ,the stock looks weak as it is making lower highs and lower lows. It also has brokend down from the triangle.Also the stock is trading below 40 WEMA.
There is small RSI divergence on weekly chart,but we can’t make much inference from the same.There is further scope of the price going down.
Weekly Chart
Disclaimer : This post is just an effort for learning few methods of price-patterns. Views are personal and are purely based on our limited knowledge of charts. No buy/sell recommendations. These are probability study methods and chances of success/failure depend upon various factors
| Subscribe To Our Free Newsletter |
