
Wanted to highlight a chart pattern for learning purposes: the Reversal of a Head and Shoulder Pattern, which ends up becoming quite a bullish pattern once it crosses above the right shoulder.
Chart for example is of Sanghvi Movers:
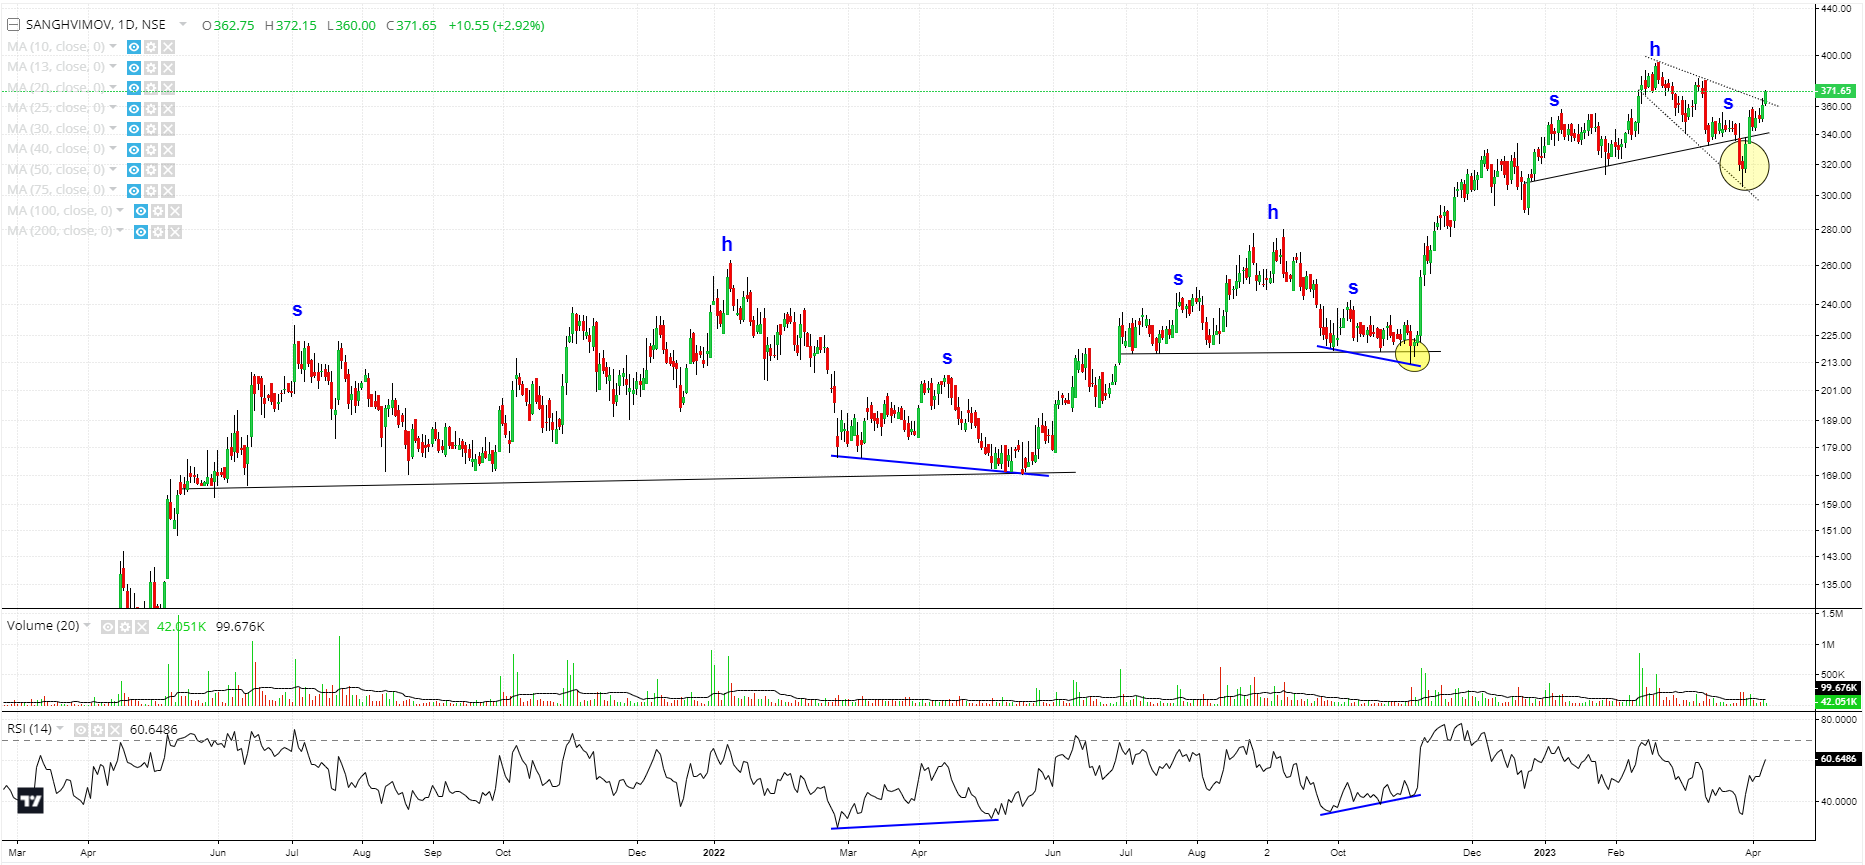
Daily Time Frame: 3 Head & Shoulder patterns formed and rejected. Twice a shakeout played out (yellow circles). Twice the right shoulder formed with a Positive RSI divergence (blue trendline).
Currently breaking out of a downward wedge.
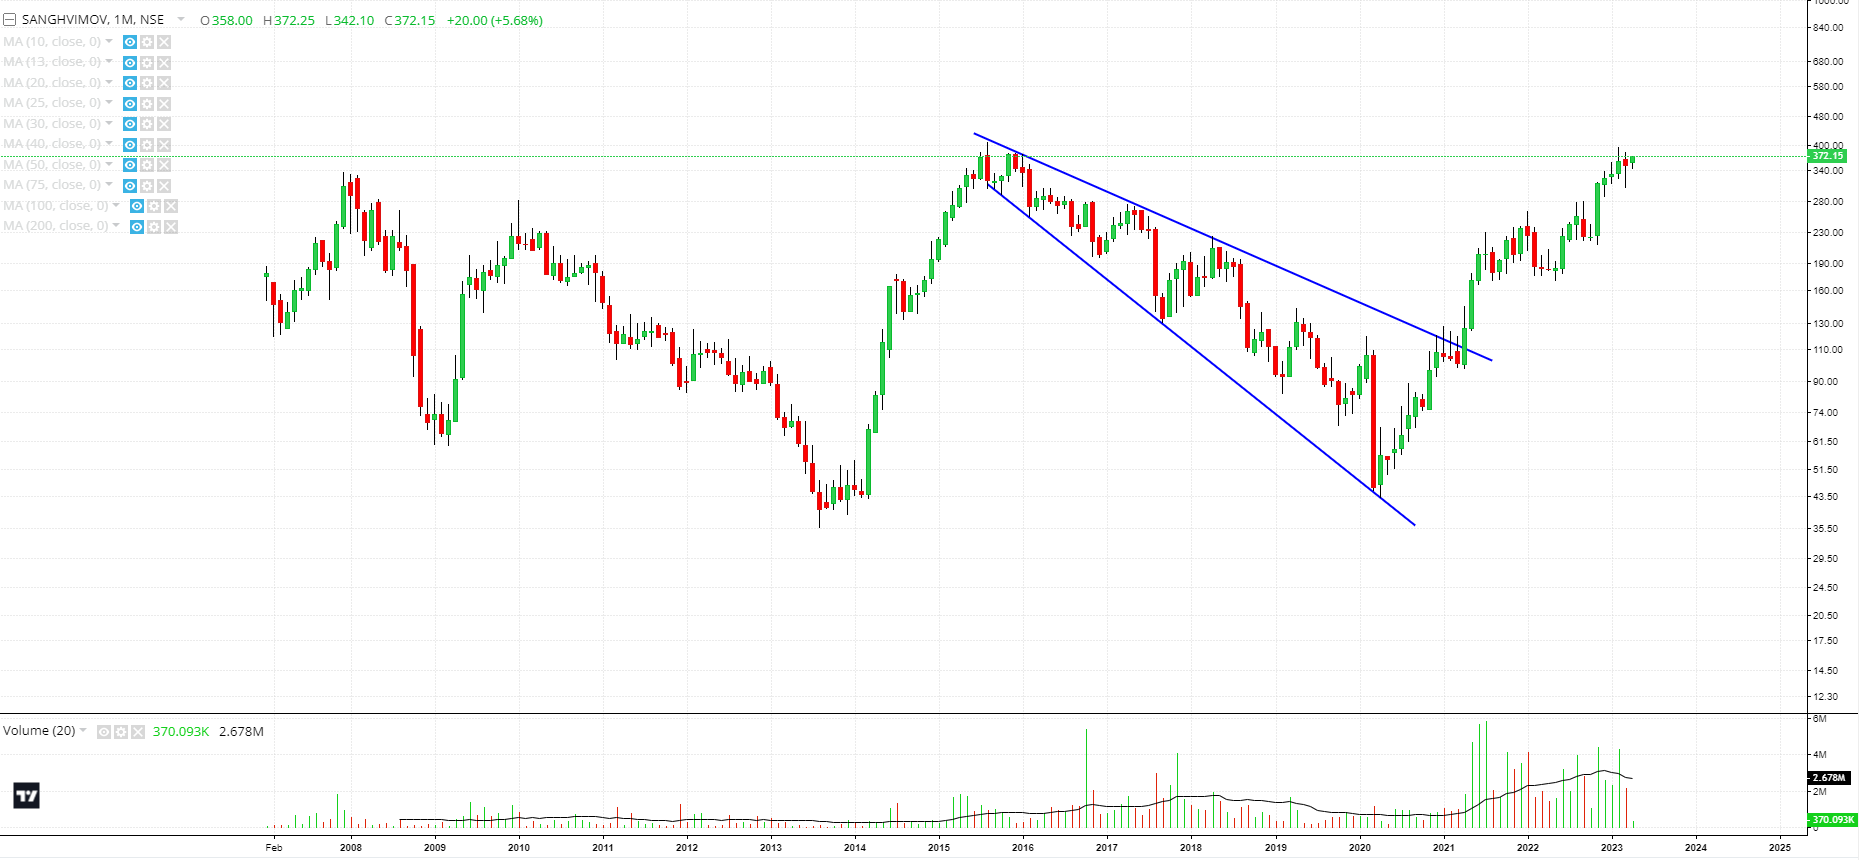
The Monthly chart forming a multi year downward broadening wedge giving its bullish upmove.
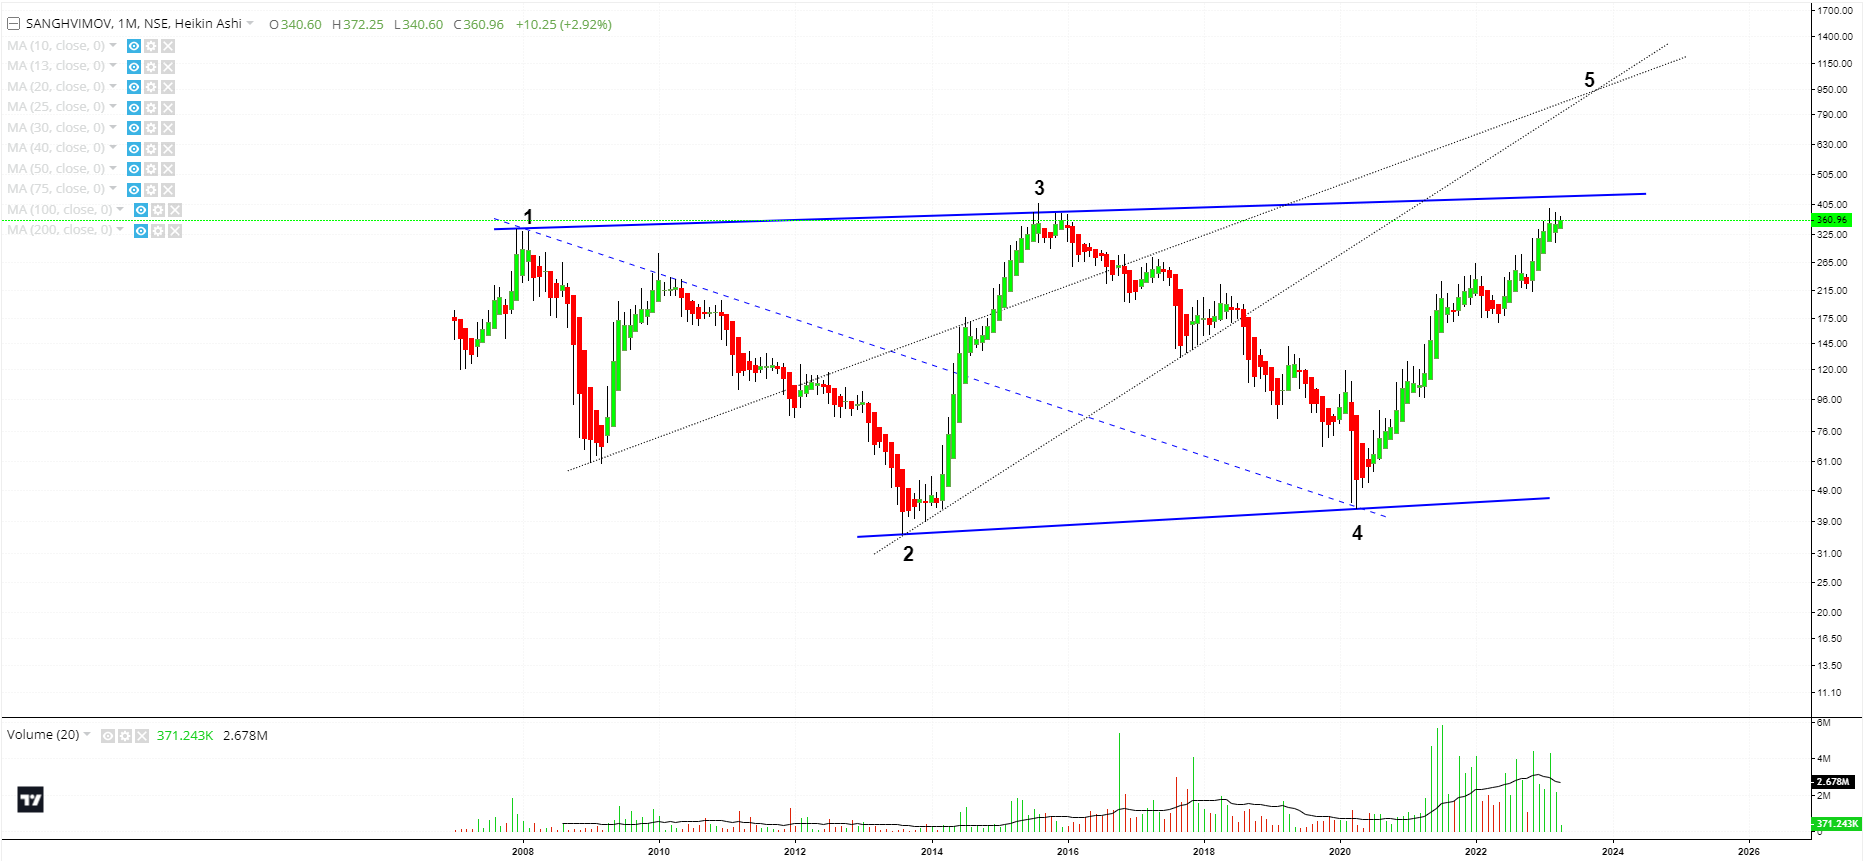
The other pattern which seems to be forming is on the monthly chart is the Wolfe Wave pattern with (5) left to complete. ( Not to sure about the accuracy of this, still learning).
Disc: Biased, invested, not a buy/sell reco, new to TA and learning.
| Subscribe To Our Free Newsletter |
