
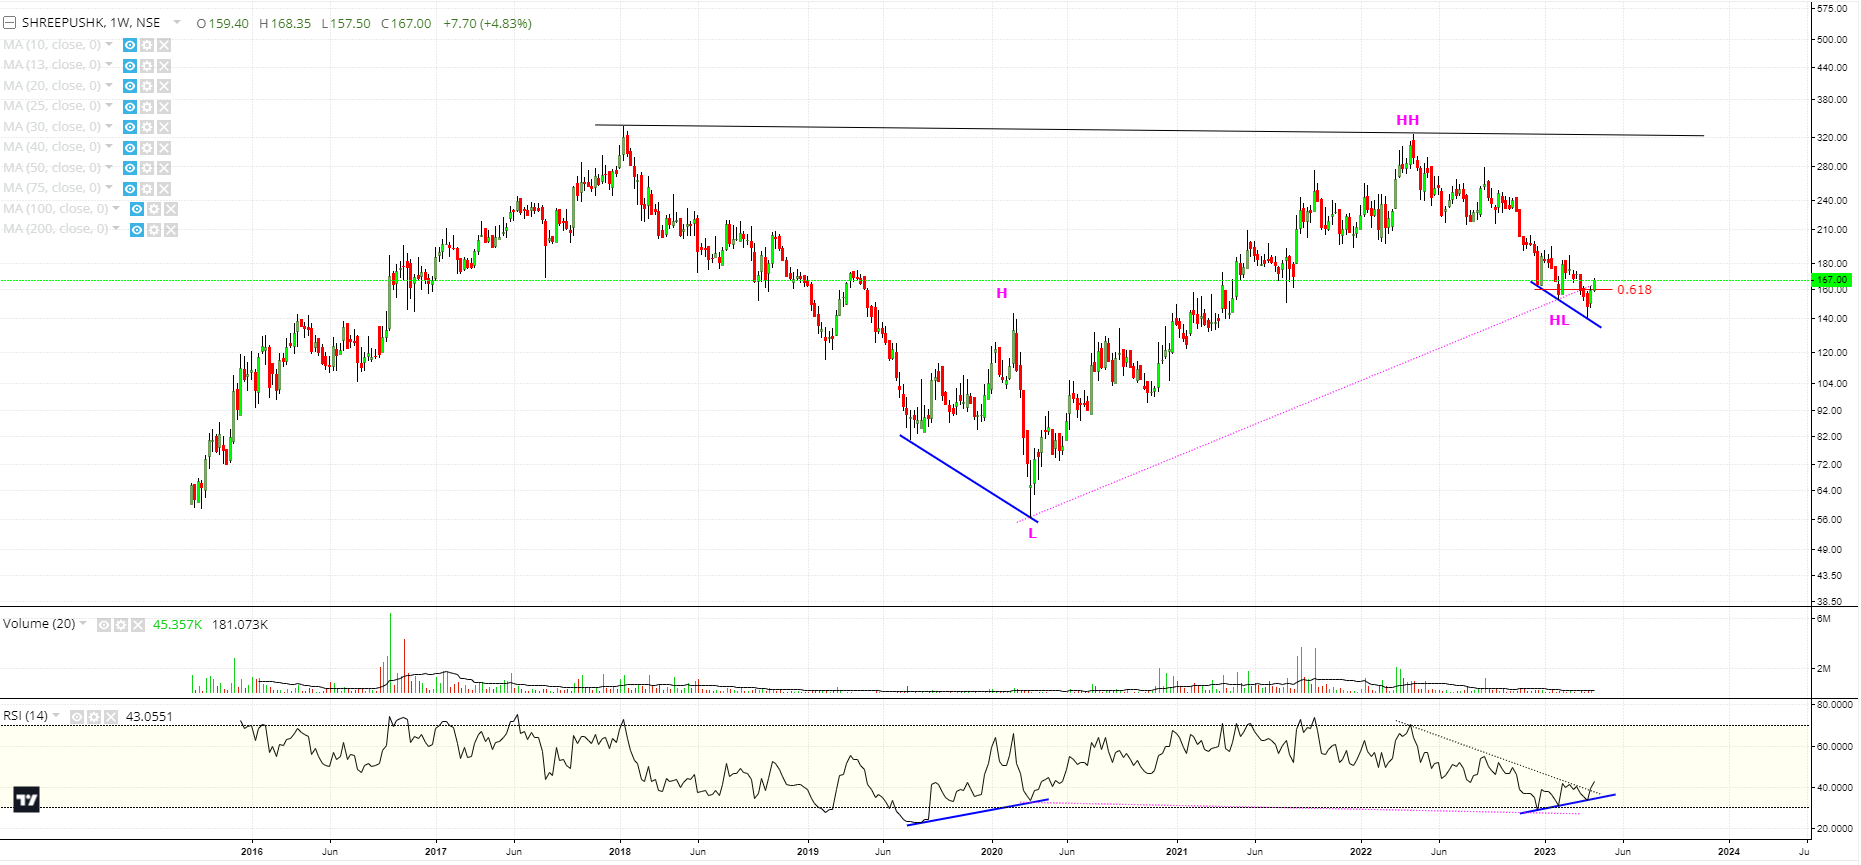
An interesting Chart which is displaying multiple bullish signals:
Shree Pushkar Chemicals: – Weekly Time Frame:
- The chart is showing a Positive RSI divergence, similar to the one seen previously, after a big drawdown (blue lines).
- The current divergence is being formed also near the Fibo 0.618 retracement level.
- There is an interesting HL, HH-HL setup which is also indicating a Hidden Bullish Divergence (Pink dotted trendline)
- A multi year Cup & Handle also seems to be forming.
Experienced TA forum members can comment and share their learnings and insights.
| Subscribe To Our Free Newsletter |
