
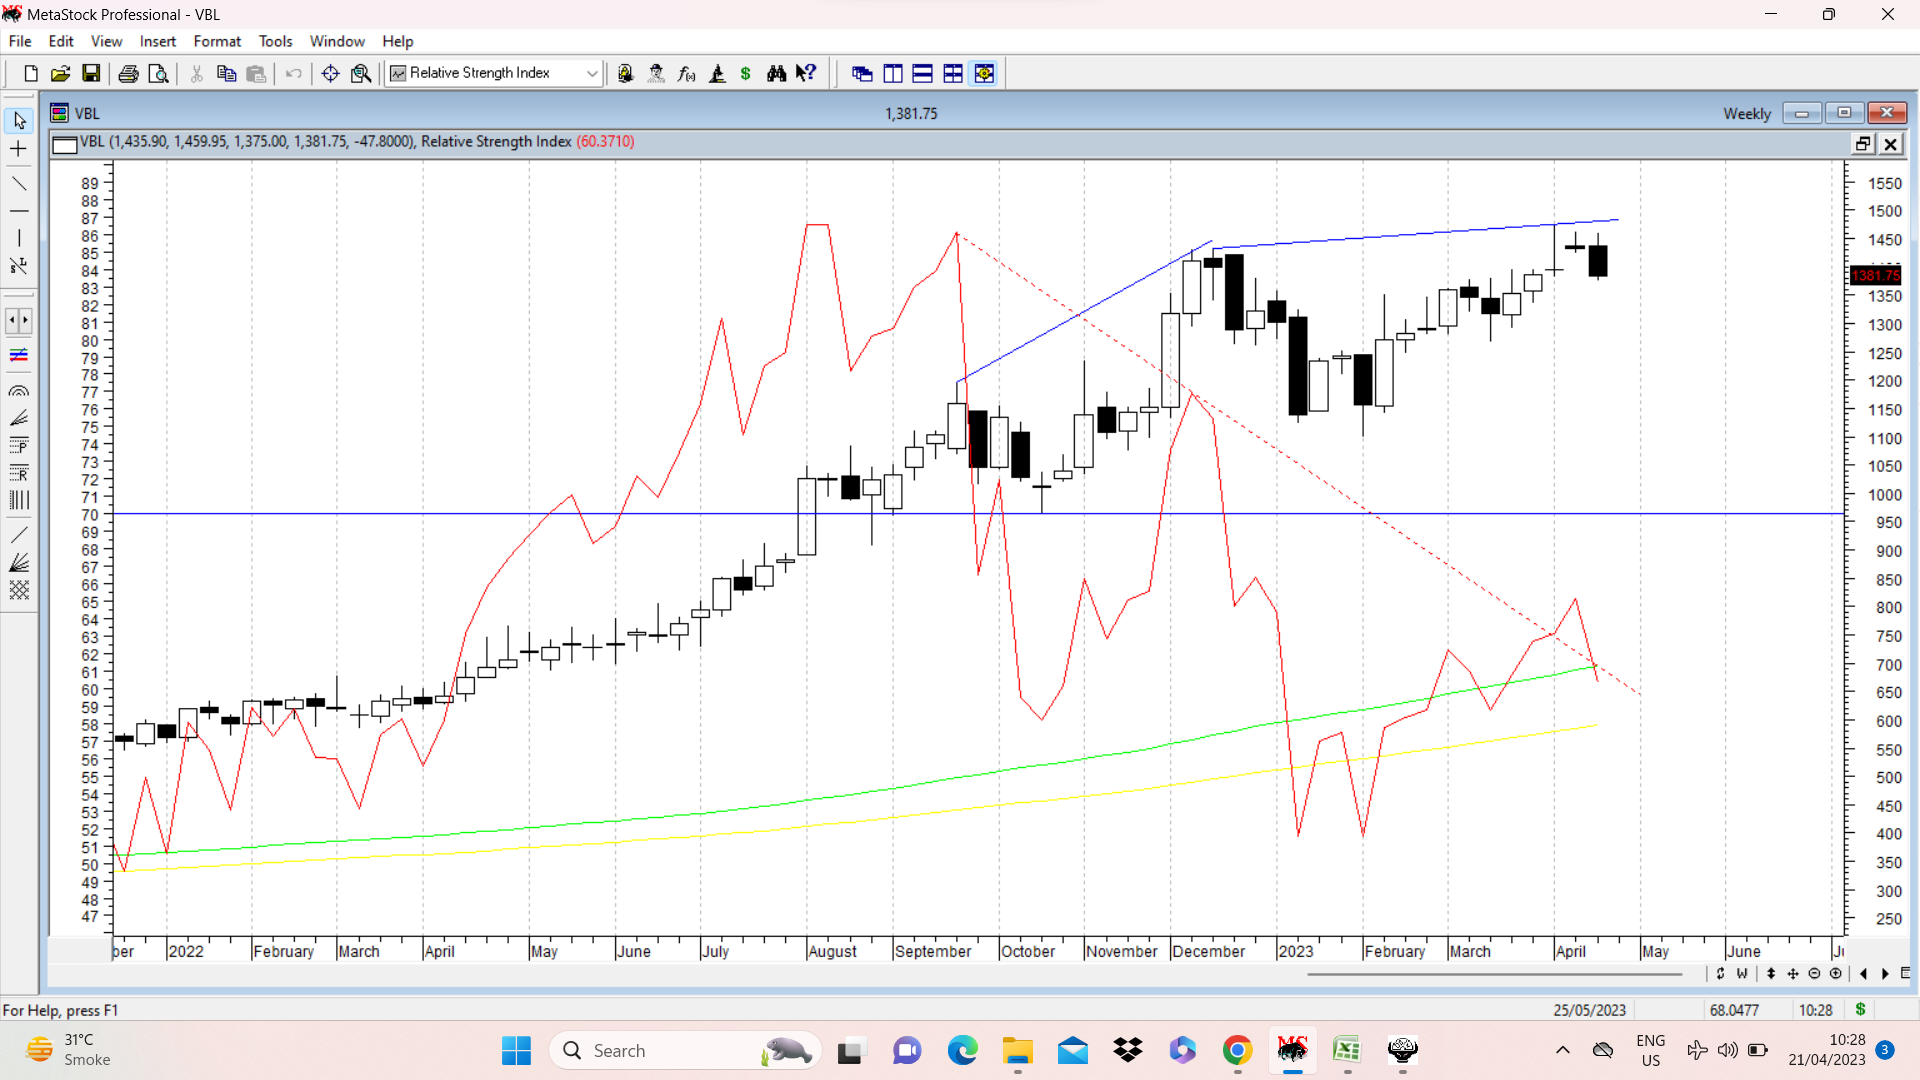
VBL has been a rank outperformer during the last few months. In the weekly candlestick chart attached, we can see clear negative divergence where stock price keeps making higher tops and RSI keeps making lower tops (marked in red lines) . Also to be noted is the characteristic of candlesticks in last 3 weeks where we see Doji and other bearish candlesticks… disc: no positions. posted only for academic purpose.
| Subscribe To Our Free Newsletter |
