
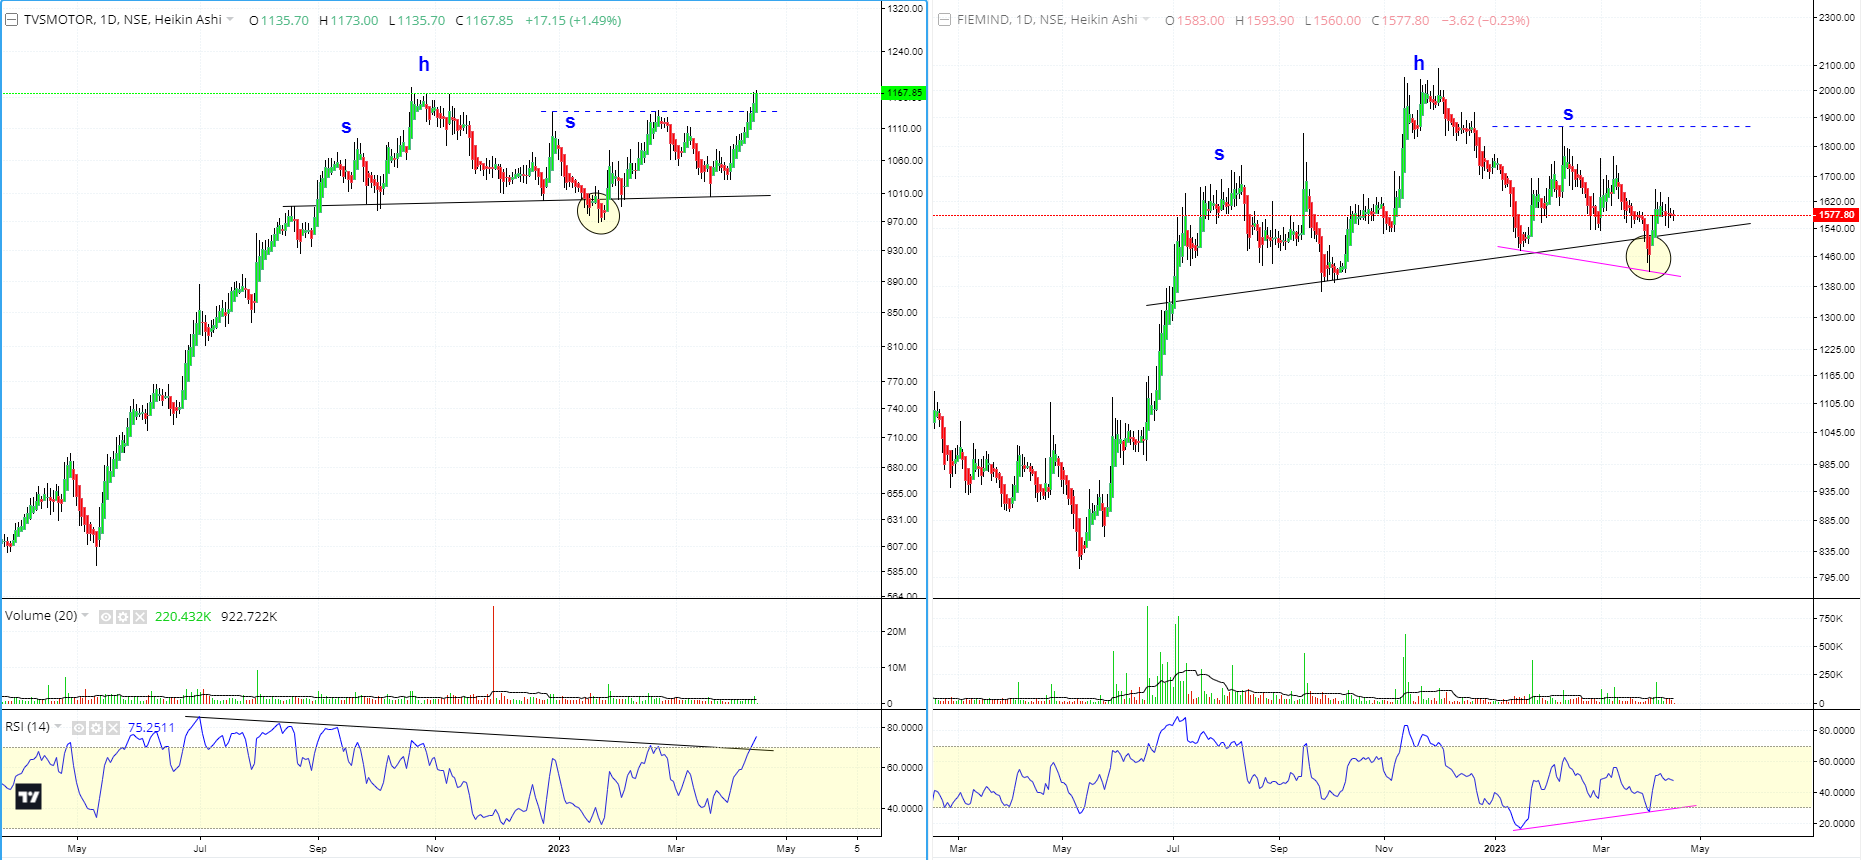
An interesting display on Daily timeframe charts of TVS Motors and FIEM Industries:
- TVS Motors is one of Fiems top clients.
- TVS has reversed from a H&S pattern and crossed the right shoulder, making it a very bullish pattern and primed for an upmove. As it can be seen (yellow circle), a shakeout also took place.
- Similarly, Fiem has seems to be reversing from a H&S pattern while giving a similar shakeout (yellow circle).
- Fiem has also formed a Positive RSI divergence (pink line).
- When both the Monthly charts are put together, we can see a very high correlation between both TVS and Fiem. the correlation currently stands at 0.88, with Fiem generally lagging, but following TVS price action.

Experienced TA forum members can comment and share their learnings and insights.
| Subscribe To Our Free Newsletter |
