
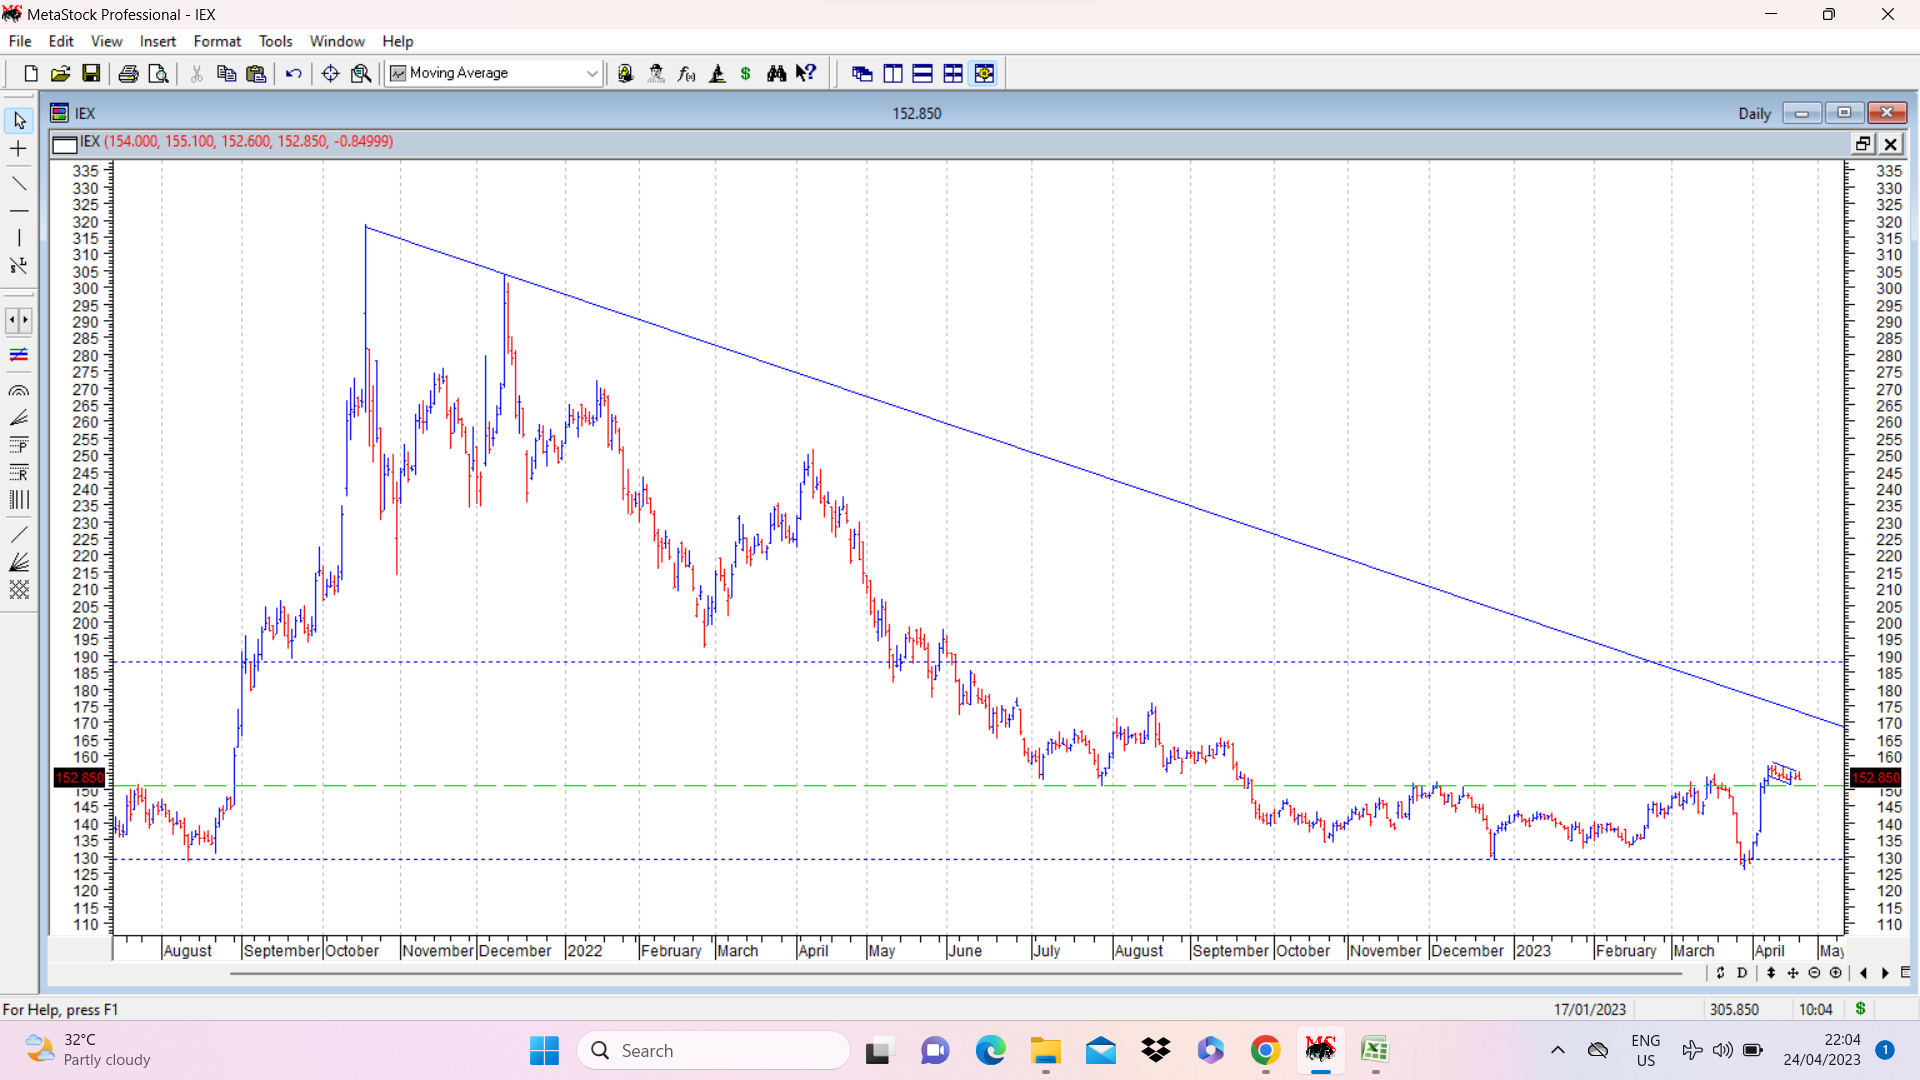
Update on IEX chart. After the weekly divergence discussed above, and a shakeout move which ended at around 126, (slightly below expected support of 129), stock price moved up quickly and went above its 200 dema and the previous strong resistance zone of 150-152 and is consolidating in a flag like pattern on daily bar chart. If this flag pattern plays out (may or may not play out) potential targets can be 186. If that happens, then stock price would cross and close above falling trendline and it would indicate a change in medium term trend. ( Usually this signifies that a buy on dips strategy should yield good results). Chart attached with small flag marked and falling trendline marked, and potential target marked in horizontal dotted line.
| Subscribe To Our Free Newsletter |
