
Below is some previous years’ data on Ador Welding’s revenues & OPM split by consumables & non-consumables segments.
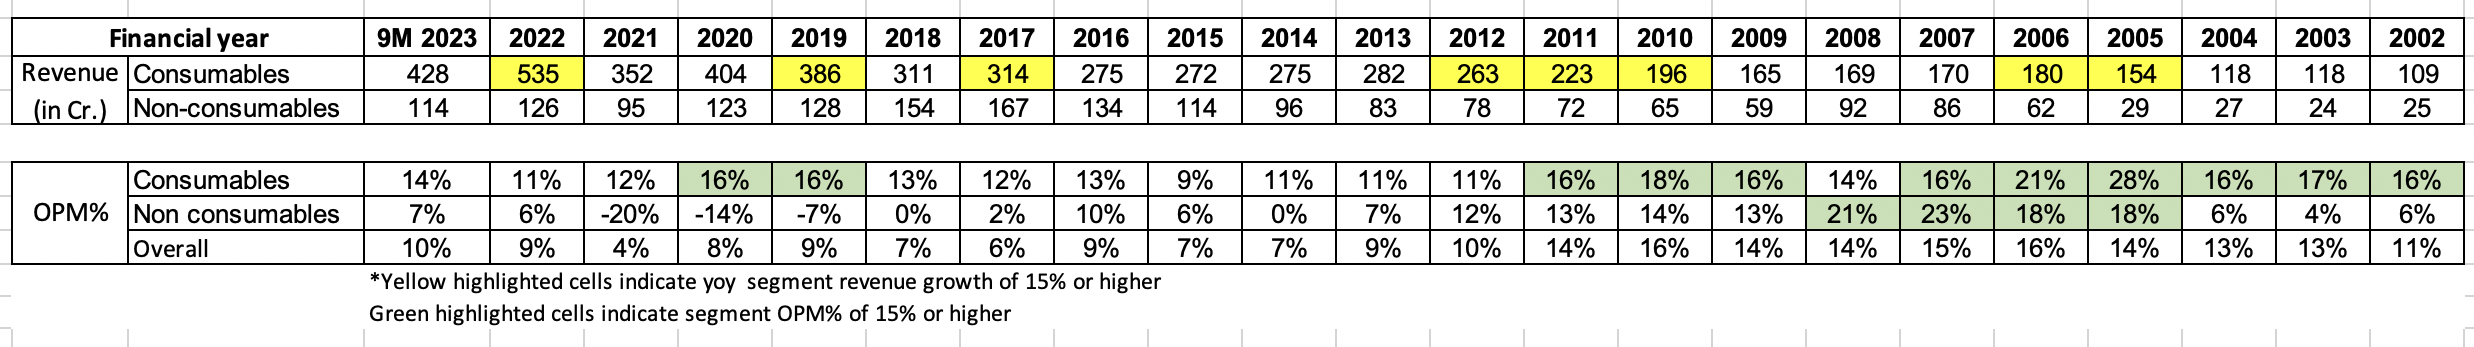
The consumables parts of their business has been around & over the 15 percent OPM mark about 50% of the time in this period (crossing 20% in the ’05-06 period of huge capex cycle led demand). While the non-consumable part has been sub 10% since the past ten years – even before the losses incurred in Kuwait project.
To me atleast, it seems that for Ador Welding to outperform in next 2-3 years, the dependency is almost fully on consumables. To get a 15% overall OPM consumables have to fire at close to 20%.
There are some early signs indicating that this might happen. The 9MFY 23 data shows a 14% consumables OPM (after a tough start to the year). The per kg. realizations are inching upwards close to early 2000 levels.
| FY | 2022 | 2021 | 2020 | 2019 | 2018 | 2017 | 2016 | No data found | 2012 | 2011 | 2010 | 2009 | 2008 | 2007 | 2006 | 2005 | 2004 | 2003 |
|---|---|---|---|---|---|---|---|---|---|---|---|---|---|---|---|---|---|---|
| Realization (Rs./kg) | 107 | 93 | 91 | 96 | 82 | 86 | 81 | 86 | 89 | 89 | 109 | 107 | 112 | 132 | 130 | 103 | 86 |
(based on data shared in company ARs & PPTs)
Disc: Not invested yet as current valuations feel high.
| Subscribe To Our Free Newsletter |
