
Hi,
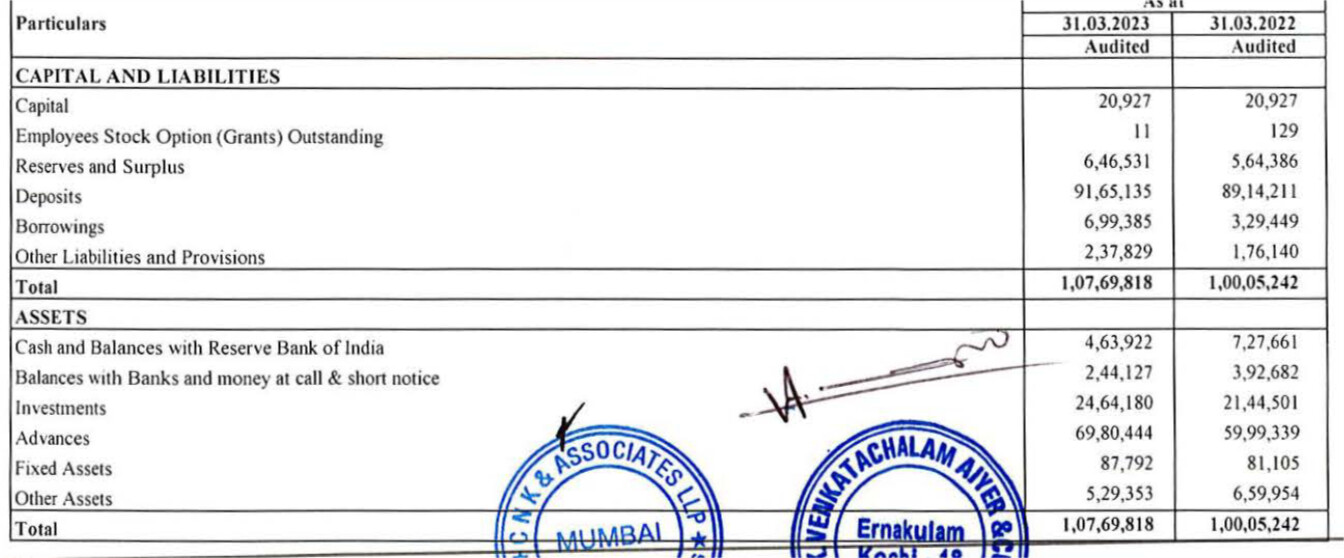
I am trying to calculate the forward book value of South Indian Bank using the information provided in their FY ’23 conference call and audited financial statements. Unfortunately, I am stuck regarding which values to use for some of the parameters that I need:
-
Firstly, I am not sure how to project NII (to eventually calculate PAT) as the bank has given no guidance. However, the bank has given guidance for NIM, which I can use to calculate NII by multiplying NIM with Average earning assets but I am not sure what value I should take for average earnings assets – only advances, total assets or a combination of some assets

-
Also, the bank has given guidance for ROA which can directly be used to calculate PAT by multiplying ROA with AUM (guidance given for advances growth) as per Investopedia. Again my question is what should I consider for AUM – total assets including cash or just advances (what I saw SOIC using) and whether I can directly apply advances growth guidance for AUM growth.
-
Next, my questions is whether I should tally numbers derived using above two numbers to ensure the management is not misleading investors.
My initial attempt at a model is as below, would be grateful for any help:
| TICKR | SOUTHBANK | ||
|---|---|---|---|
| TICKR_Google | NSE:SOUTHBANK | ||
| Share price | 19.05 | ||
| FY23 | FY24 | FY25 | |
| Interest Income | 7,233 | ||
| Interest Expense | 4,221 | ||
| NII | 3,012.08 | 3,373.53 | 3,778.35 |
| % YoY Growth | 12.00% | 12.00% | |
| Non Operating Income | 813 | 910.15 | 1,019.36 |
| % YoY Growth | 12.00% | 12.00% | |
| Total Income | 3,824.71 | 4,283.68 | 4,797.72 |
| Total opex | 2,317 | 2,356.02 | 2,638.74 |
| % YoY Growth | 1.67% | 12.00% | |
| % Cost-to-income | 60.59% | 55.00% | 55.00% |
| PPOP | 1,507.33 | 1,927.65 | 2,158.97 |
| Credit cost | 399 | 750.00 | 841.02 |
| Credit cost % | 0.55% | 0.93% | 0.93% |
| PBT | 1,108.21 | 1,177.65 | 1,317.95 |
| Taxes | 333 | 354 | 396 |
| Tax % | 30.06% | 30.06% | 30.06% |
| PAT | 775.09 | 823.66 | 921.79 |
| PAT from ROA | 807.4 | 904.3 | |
| Shared ROA | 1% | 1% | |
| ROA | 1.08% | 1.02% | 1.02% |
| AUM | 72,092 | 80,743 | 90,432 |
| % YoY Growth | 12.00% | 12.00% | |
| ROE | 11.61% | 11.01% | 10.99% |
| Paid Up Capital | 209 | 209 | 209 |
| Reserves & Surplus | 6,465 | 7,272.74 | 8,177.06 |
| Net Worth | 6,674.58 | 7,482.01 | 8,386.33 |
| No. of shares | 209.5 | 209.5 | 209.5 |
| Book Value | 31.86 | 35.71 | 40.03 |
| 0.53 | 0.48 | ||
| CAGR Growth | |||
| Exit multiple of P/BV | 2 yr CAGR | ||
| 0.5 | 20.02 | 2.50% | |
| 0.6 | 24.02 | 12.29% | |
| 0.8 | 32.03 | 29.66% | |
| 1 | 40.03 | 44.96% |
| Subscribe To Our Free Newsletter |
