
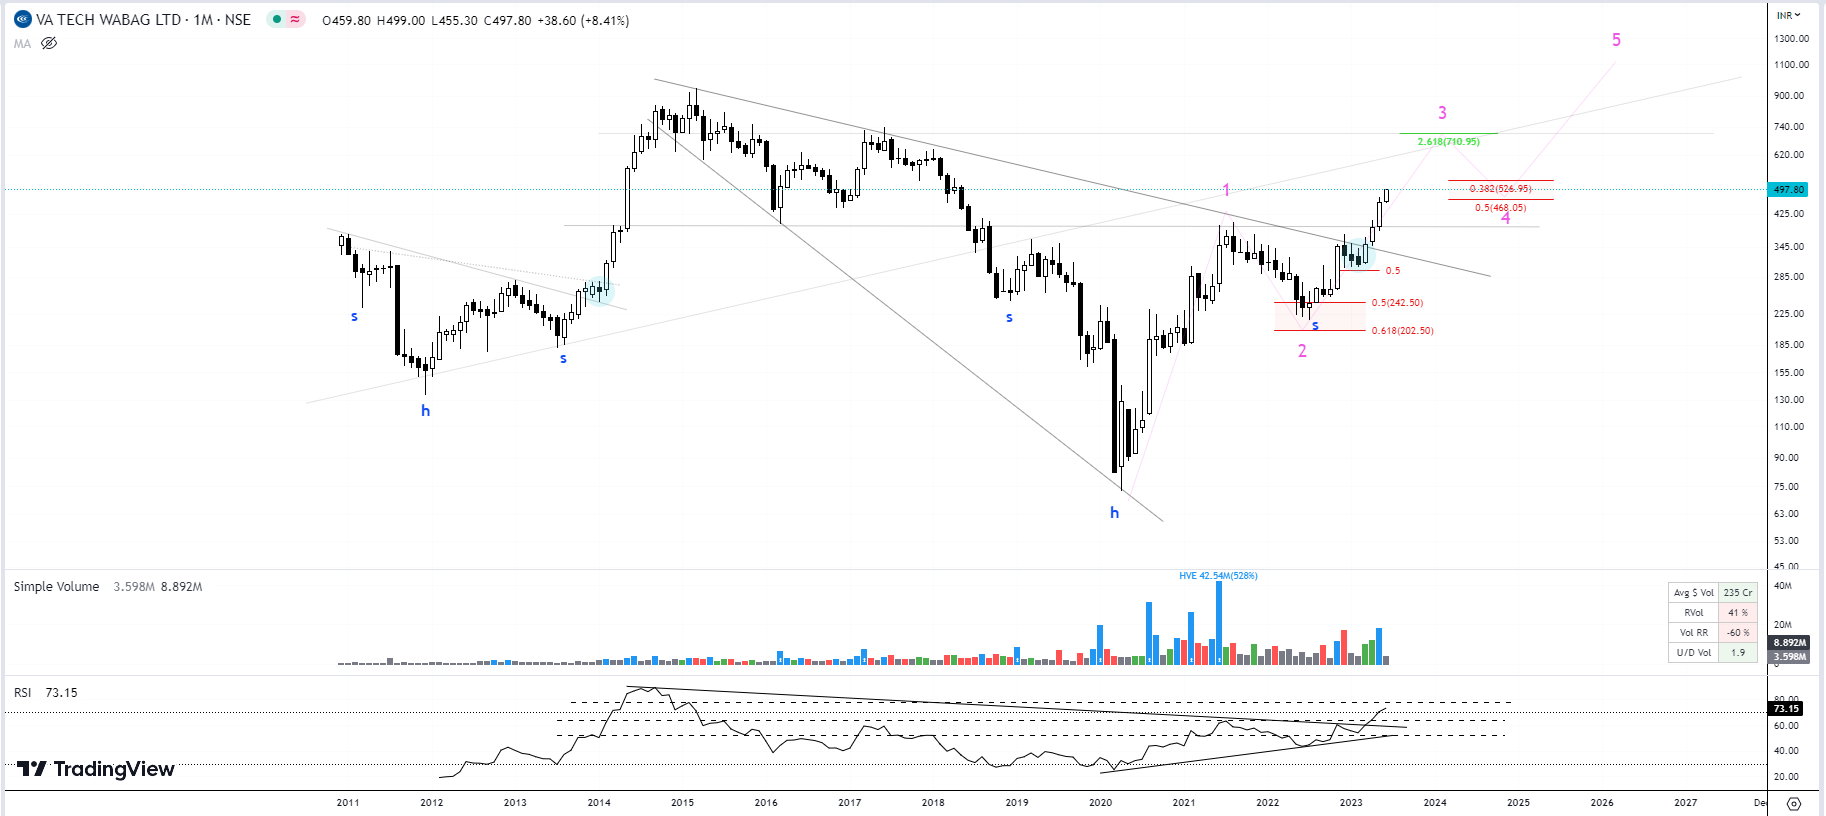
Another Chart where Multiple patterns are playing out, making it quite a bullish chart is Va Tech Wabag (Monthly chart):
- From 2011-2013, we saw an Inverse H&S formation, leading to a breakout move from ~250 to 900 odd levels.
- From ATH top in 2015, we can see a multi year downward broadening wedge for 8 years till Feb 2023. This gave a breakout at ~350 levels.
- The reversal also included an Inverse H&S reversal pattern from 2018 to 2023, which has given a breakout as well.
- With multiple multi year pattern and RSI breakouts, the stock seems to have reversed and is possibly bullish for the next few years.
| Subscribe To Our Free Newsletter |
