
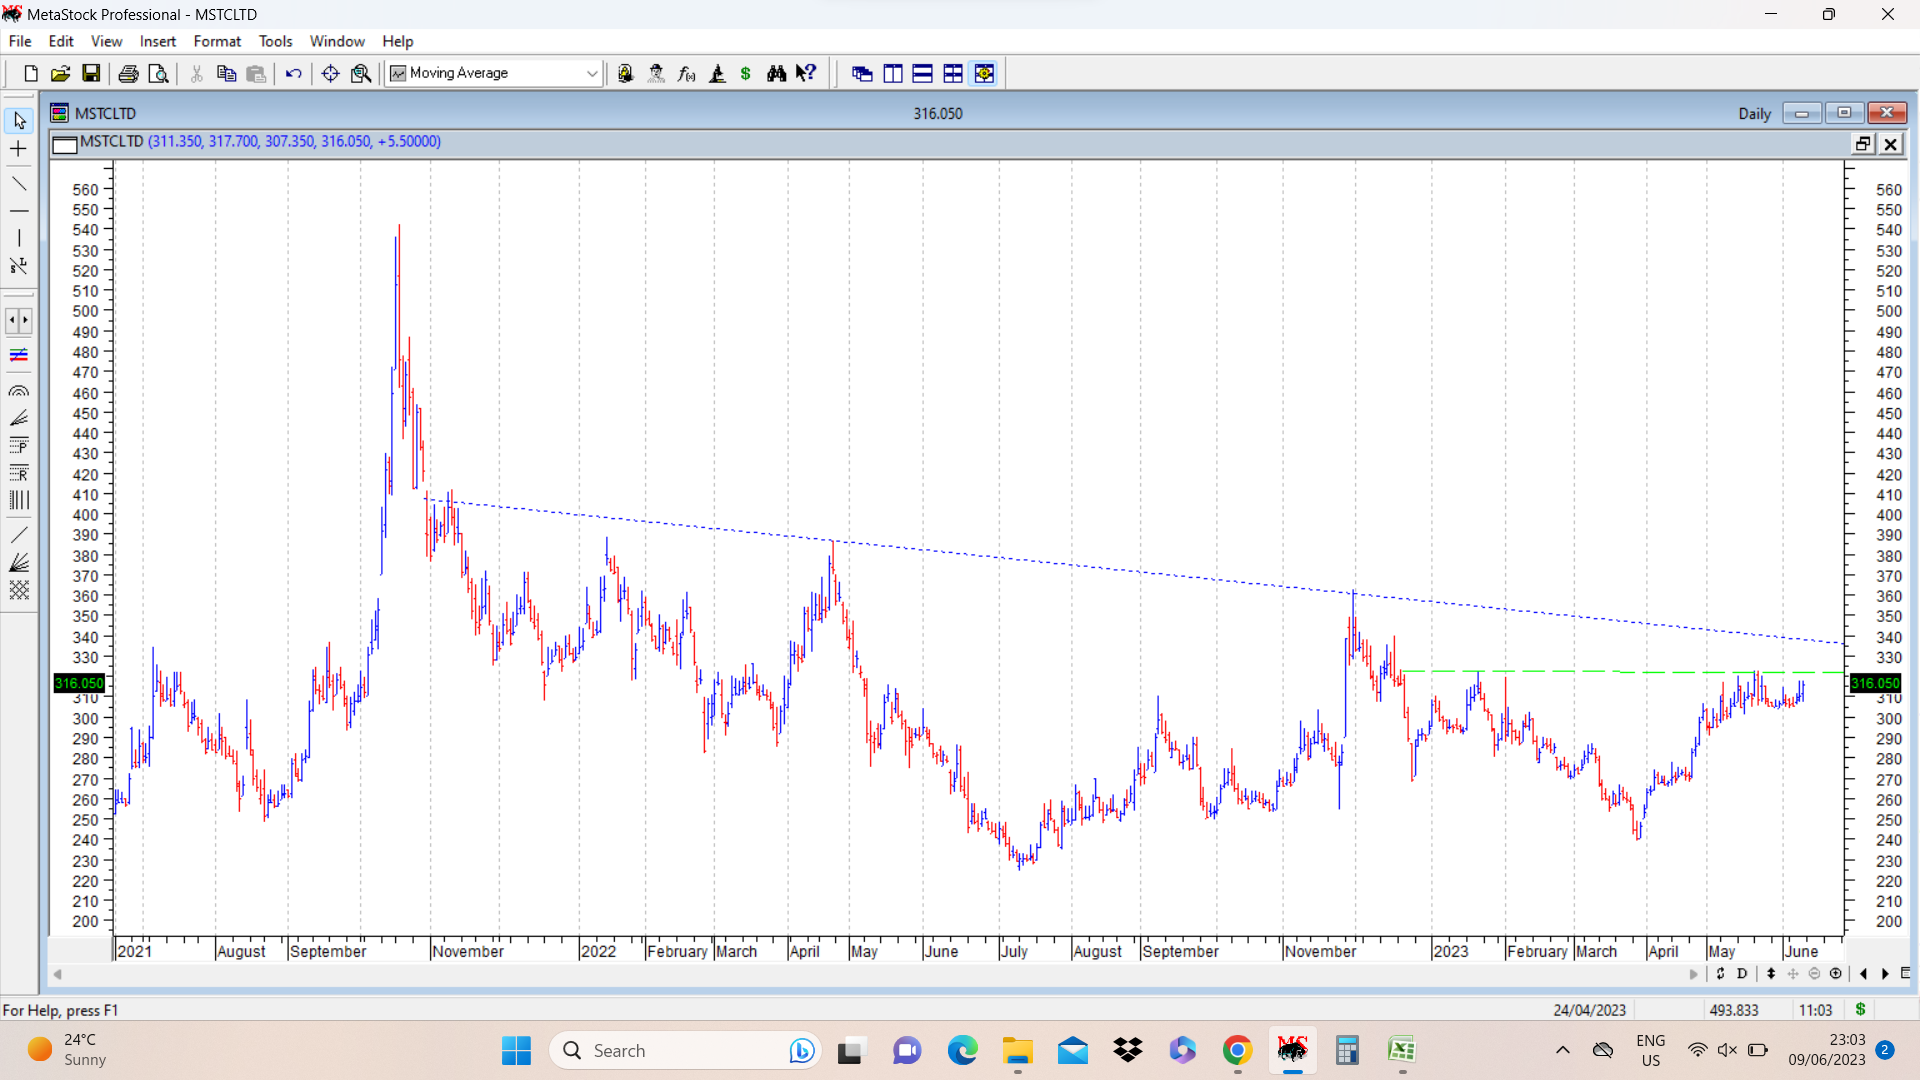
MSTC is a good example of confluence of many technical patterns in same chart. Putting up my own interpretation of daily charts. I can see two potential inverted head and shoulders pattern breakout possibilities. Slightly longer term is what you put up and I have marked that pattern neckline in dotted blue lines. There is another shorter inv head and shoulders pattern breakout possibility and here I have marked neckline in dotted green lines…
All these kind of confluent technical patterns make for interesting learnings and thanks for bringing these up on this forum.
Current price is 316. Breakout from both inverted head and shoulders pattern would be confirmed on move above 340, which is another 10% up from current levels. I would keep this in my watchlist and try to buy once it clears 340 (if I can manage to free up some funds)
| Subscribe To Our Free Newsletter |
