
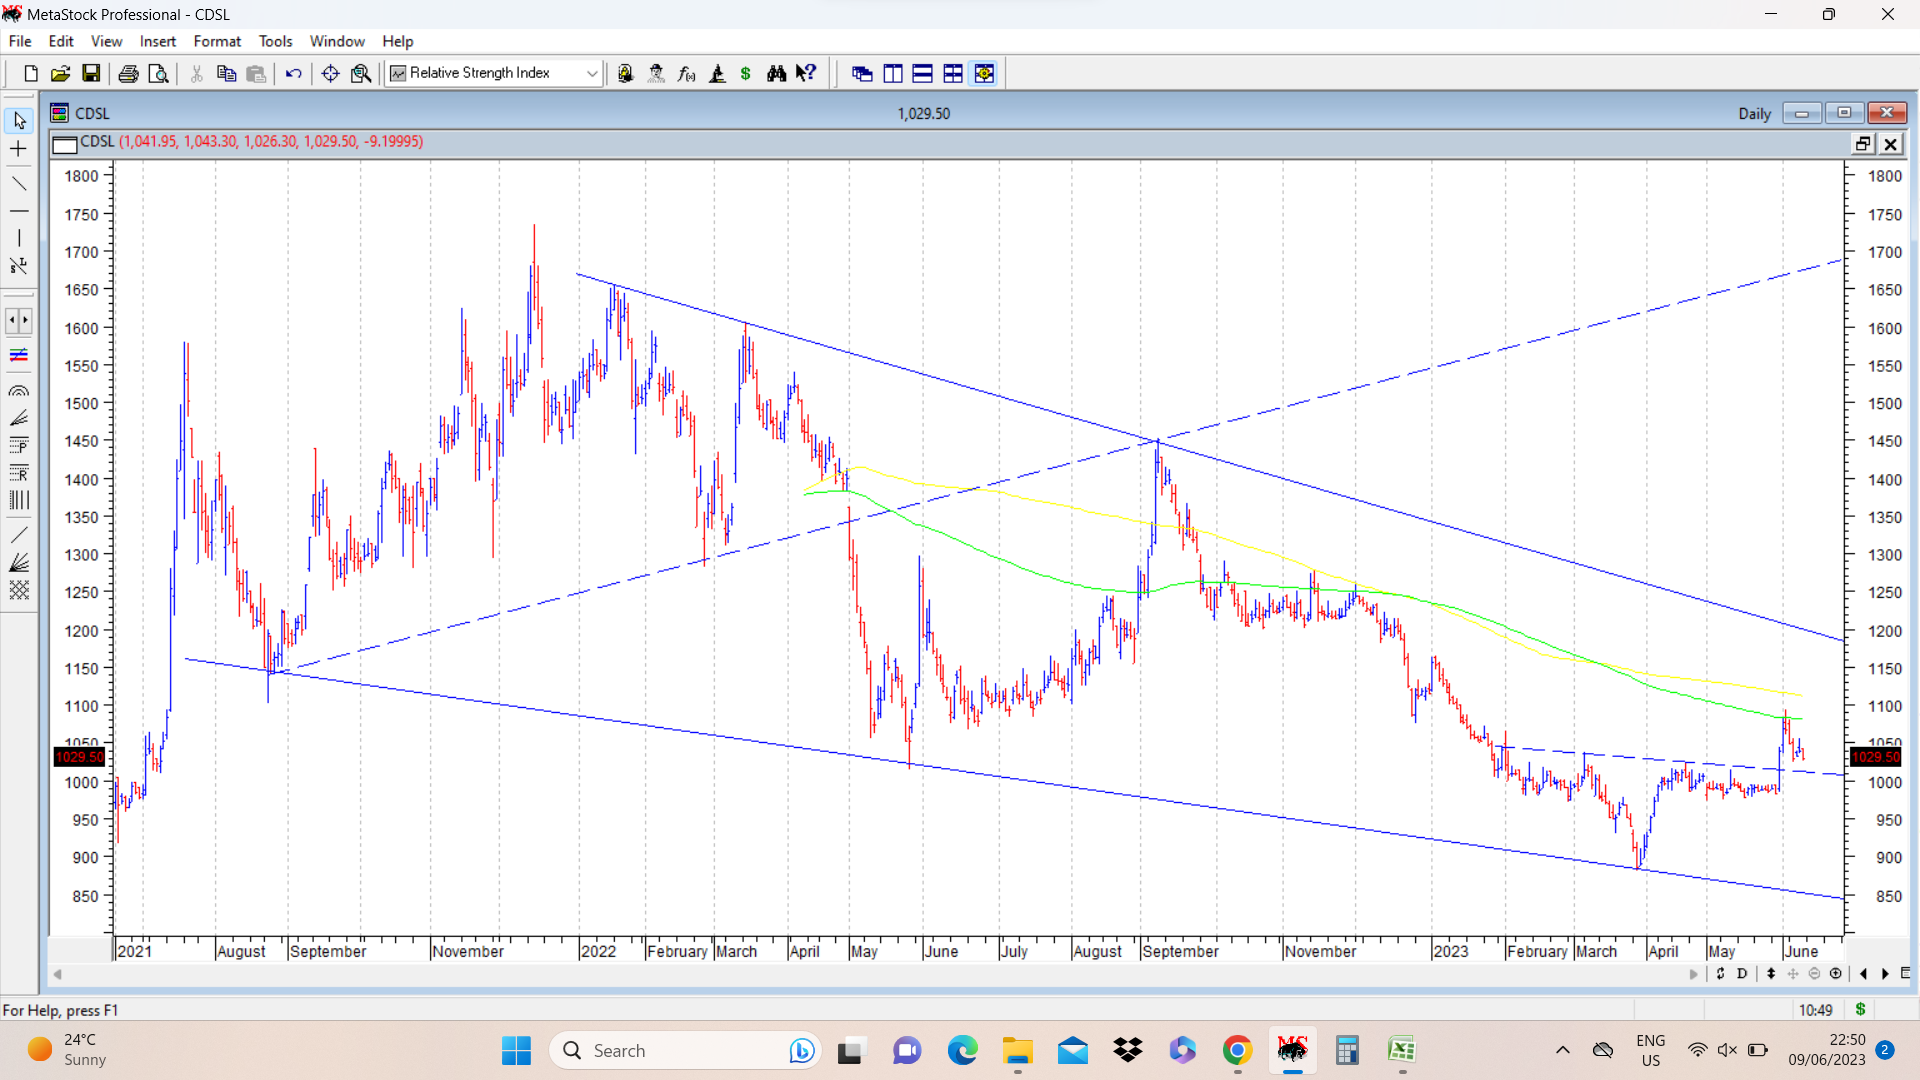
CDSL was a much touted “platform” stock in the past and the stock price had rallied from 200 in March 2020 to a high of 1700 in Dec 2021, nearly 8.5 bagger in a short period of 15 months. After that it went into a triangular corrective mode and made a low of 880 and moved up and has now broken out of a small head and shoulders pattern (neckline drawn in dotted blue lines. After breaking out from this inverted h & s pattern, it went up to touch its falling 200 dema at 1093 and started correcting (as is usually expected. In early phase of an upmove there is a definite correction from expected resistances unless the primary trend is very very strong. )
On daily charts when bottom was formed, there were positive divergences. The daily chart also displays a Wolfe Wave pattern for a potential target of 1700. Breakout from triangle would happen once it crosses levels of 1200 in near term.
disc: invested at around current prices. More as a techno funda bet, with small allocation , to be scaled up if pattern plays out as expected. ( This chart is put up only for academic purpose, and anyone buying should do their own diligence. ) Chart is very interesting because of confluence of different patterns.
| Subscribe To Our Free Newsletter |
