
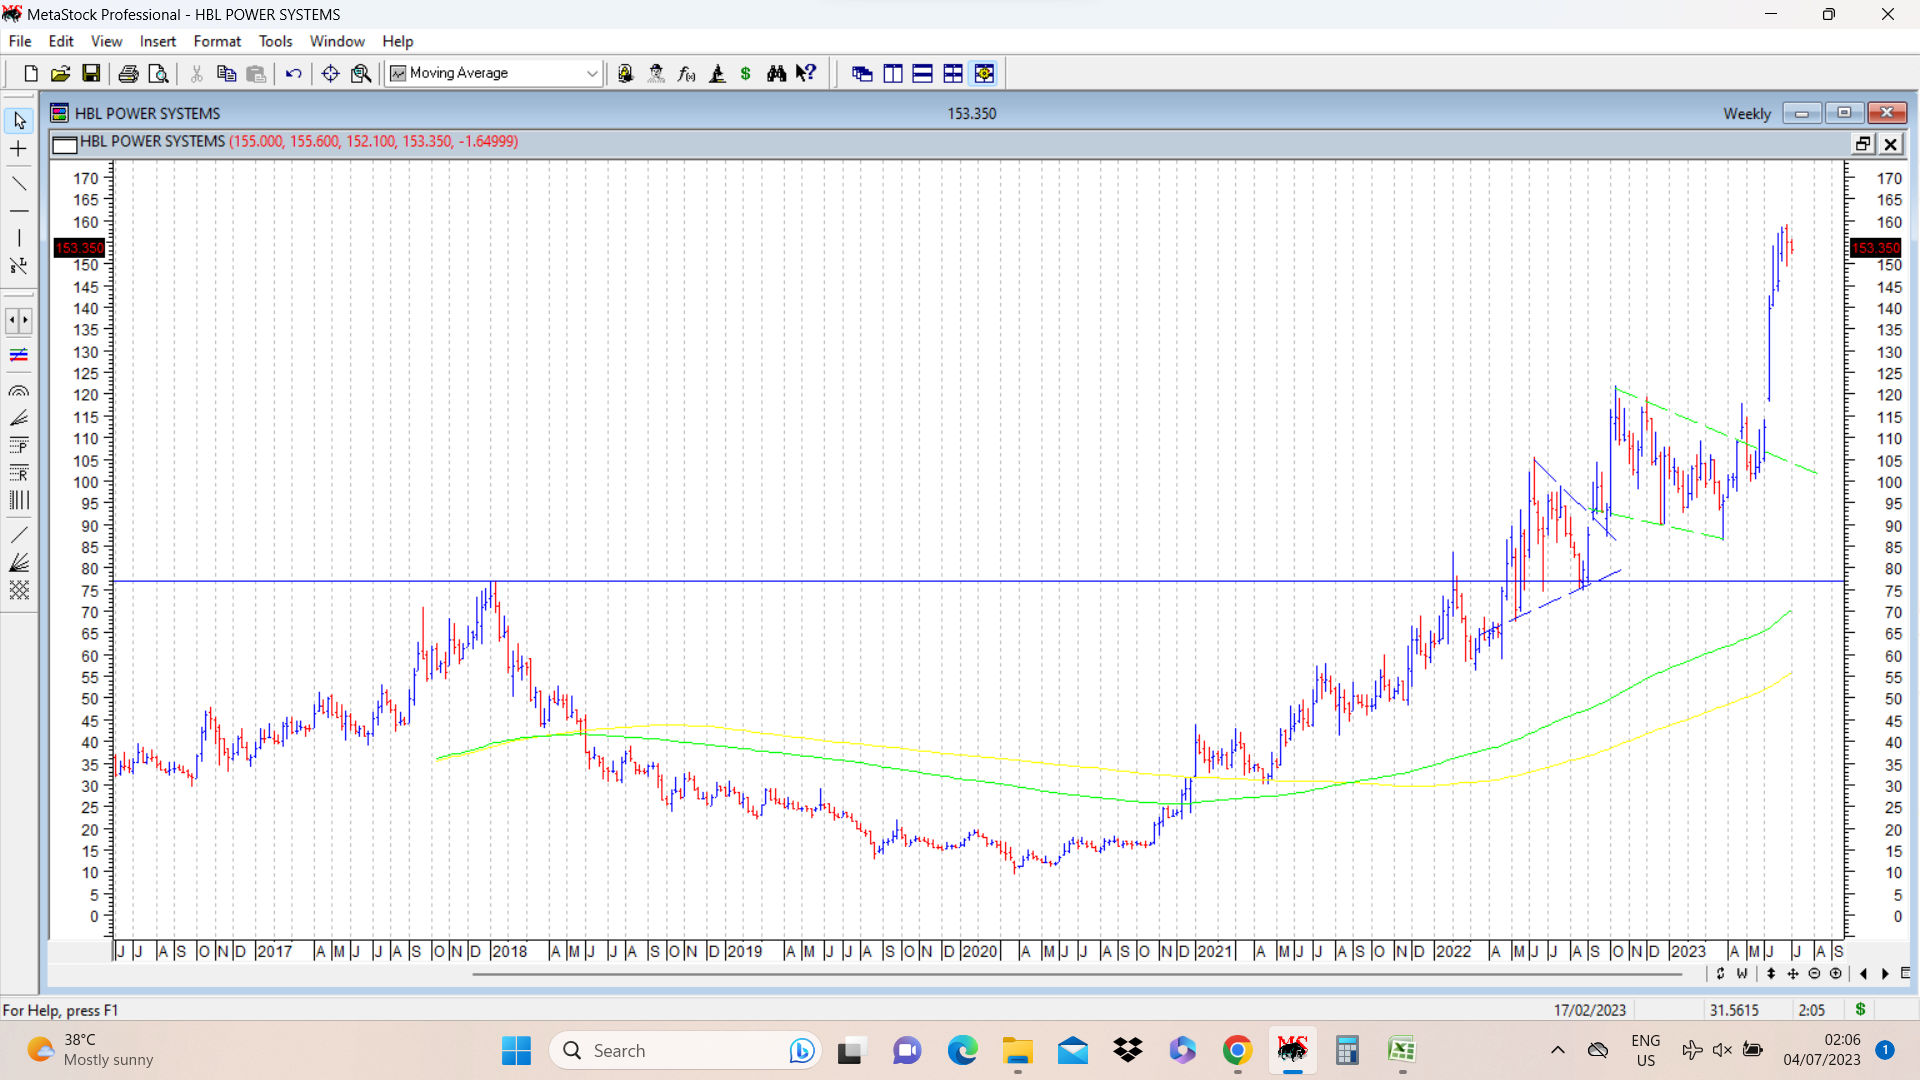
In continuation of the triangular consolidation after clearing previous ATH, an example of HBL power is posted in chart below. In this weekly chart, once the previous ATH of 77, stock price underwent a triangular consolidation as marked in blue dotted lines. Once it broke out of this triangle it underwent another consolidation in a triangular formation as shown in green dotted lines. This is something similar to what William O Neil refers to as base on top of a base formation.
Once stock price broke out of the base on top of base formation, it started showing signs of strong momentum and continues to remain strong.
I think these kind of consolidations are good for accumulation for those who believe in story or in power of charts. And these are often frustrating for those having lower conviction or are investing on borrowed conviction.
| Subscribe To Our Free Newsletter |
