
An Interesting Pattern i am observing in the Monthly Time Frame chart of Dlink India:
Have come across a few examples exhibiting the same, will post their charts first, followed by the chart of Dlink India:
- In Multi Year Breakouts, on Monthly TF, when a Horizontal Trendline is drawn, one can observe a breakout, then a fall (giving signals of a failed breakout, followed by tightening) around the breakout levels.
- The develops into a Symmetrical Triangle Pattern, followed by a sustained breakout with high volumes.
- One could call is consolidation before a bigger upmove (just before a breakout) or shaking out weaker hands by signaling a failed breakout.
- However if one sees examples, these symmetrical triangle breakouts then lead to tremendous up moves.
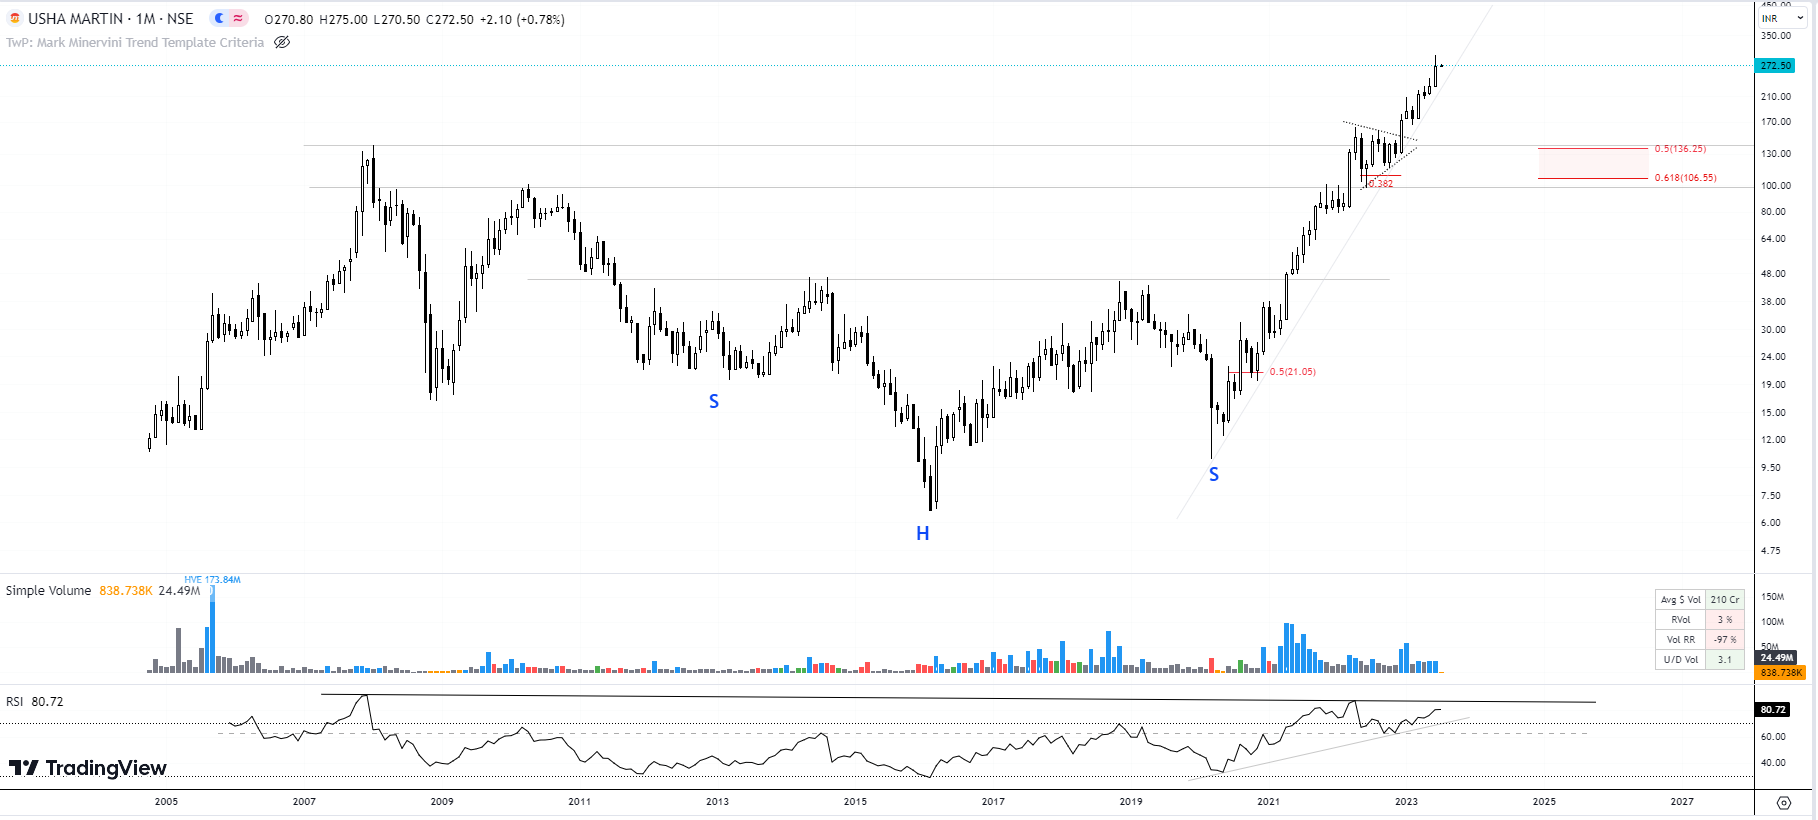
Eg1: Usha Martin: A Symmetrical Triangle pattern formed around the highs of 2007. Breakout, then failed breakout, consolidation/tightening and then the pattern breakout followed.
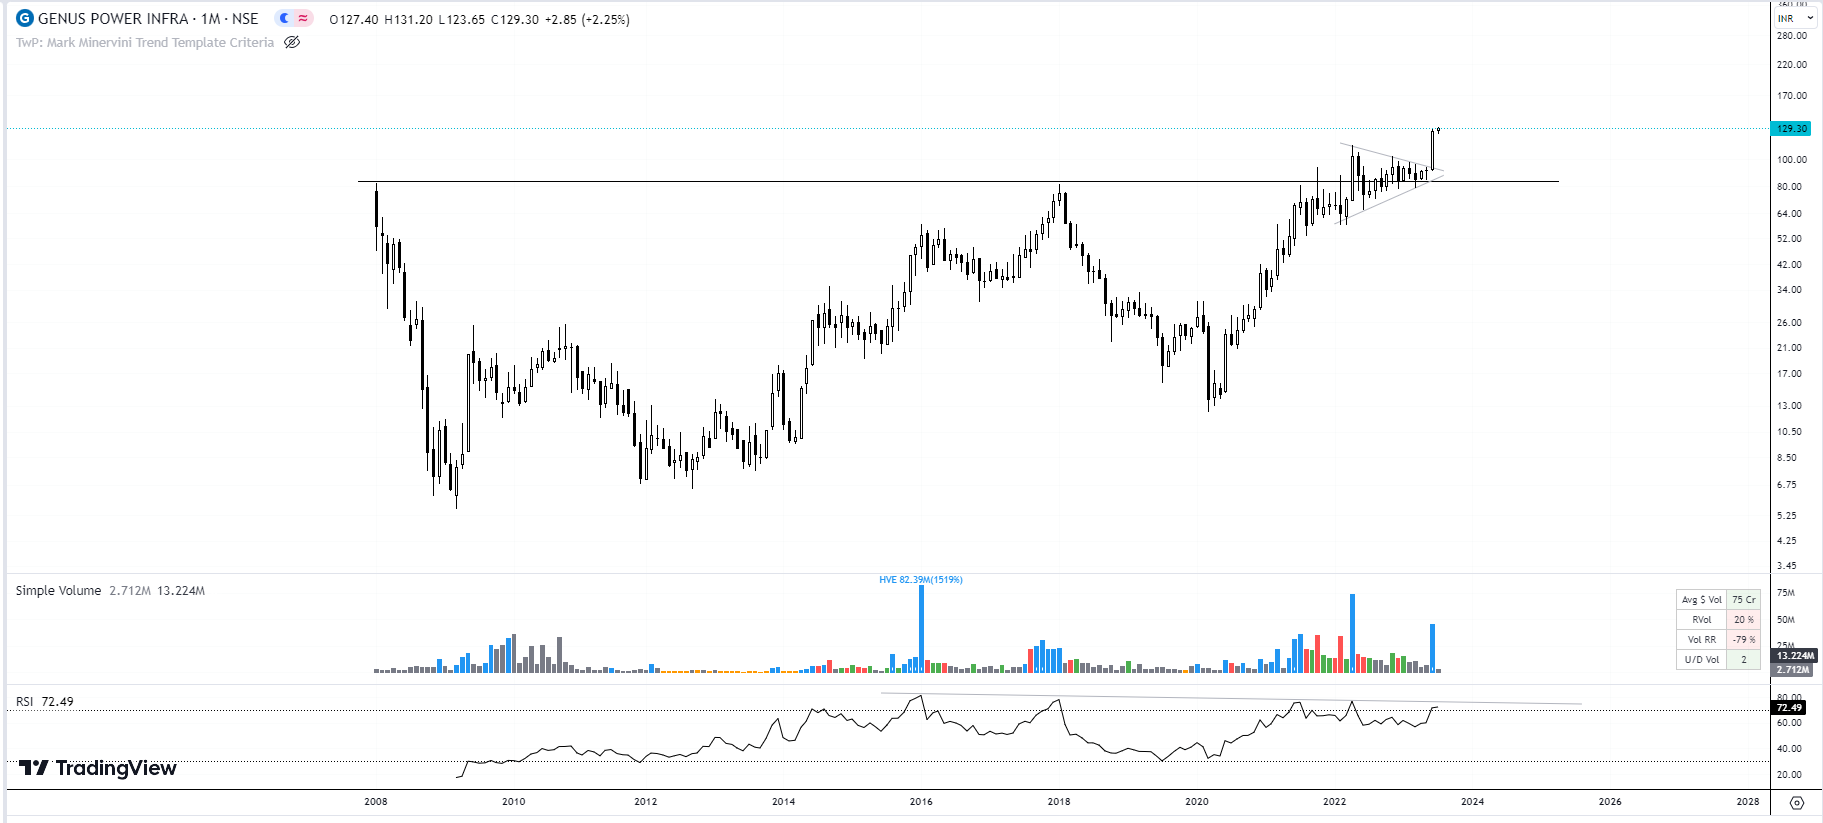
Eg 2: Genus Power (More recent Setup): A Symmetrical Triangle pattern formed around the highs of 2008. Breakout, then failed breakout, consolidation/tightening and then the pattern breakout followed.
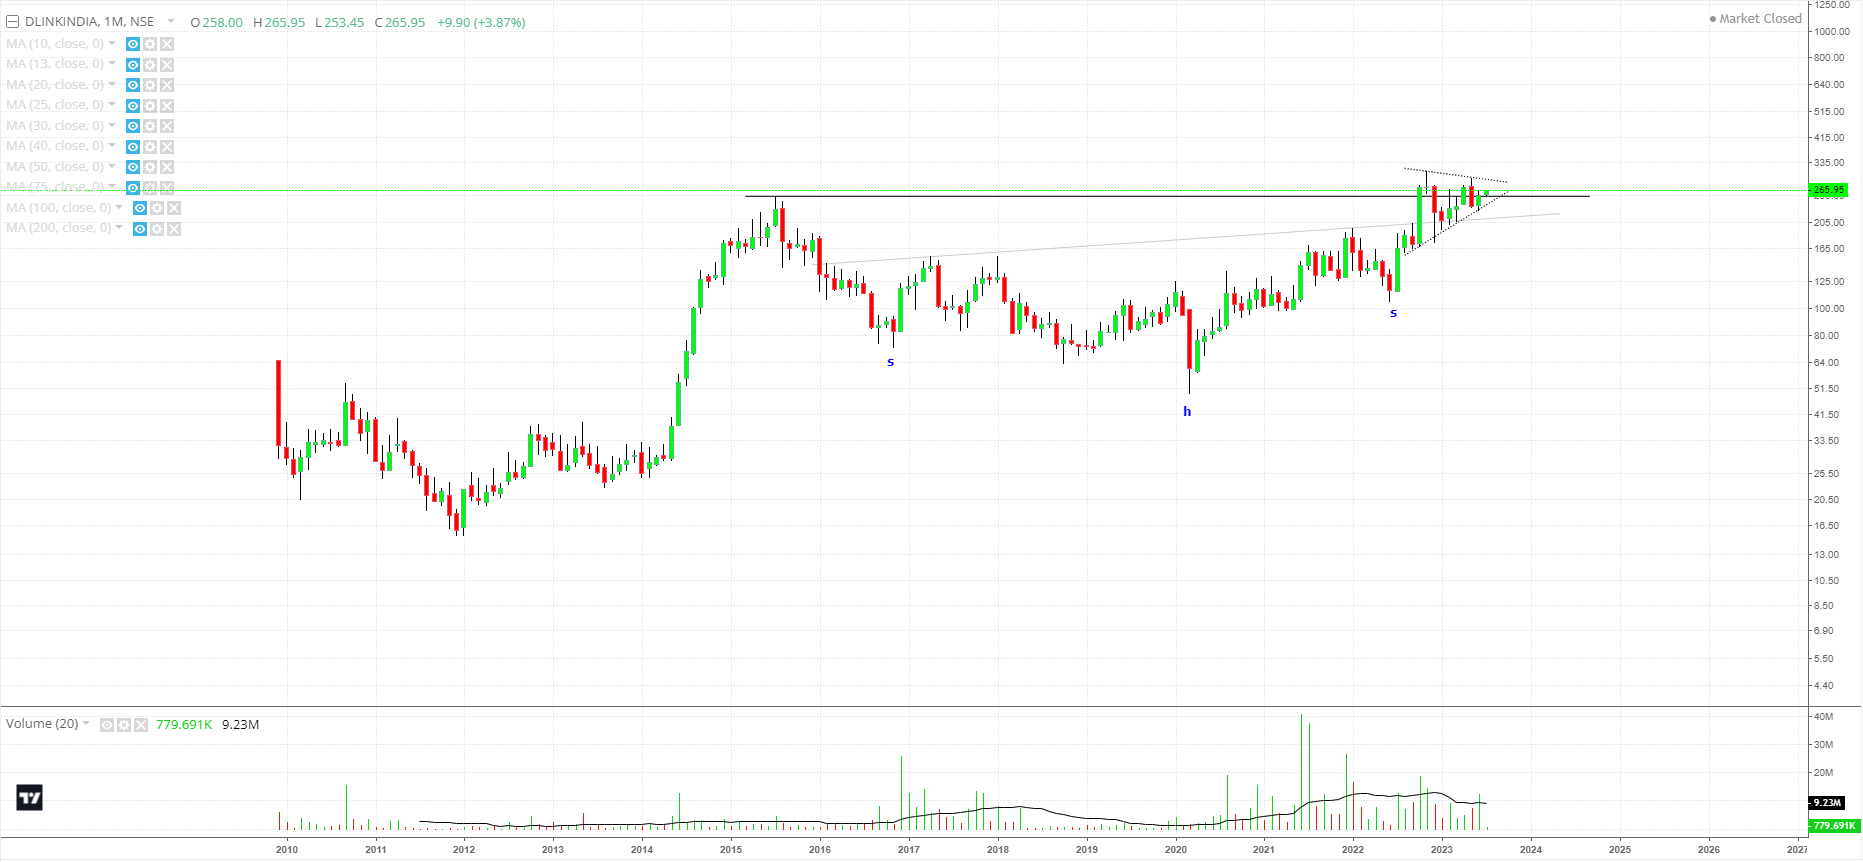
Now coming to the DLink setup which currently seems to be in progress:
- A Symmetrical Triangle pattern forming around the highs of 2015. Breakout, then failed breakout, consolidation/tightening in progress.
More examples and views welcome.
| Subscribe To Our Free Newsletter |
