
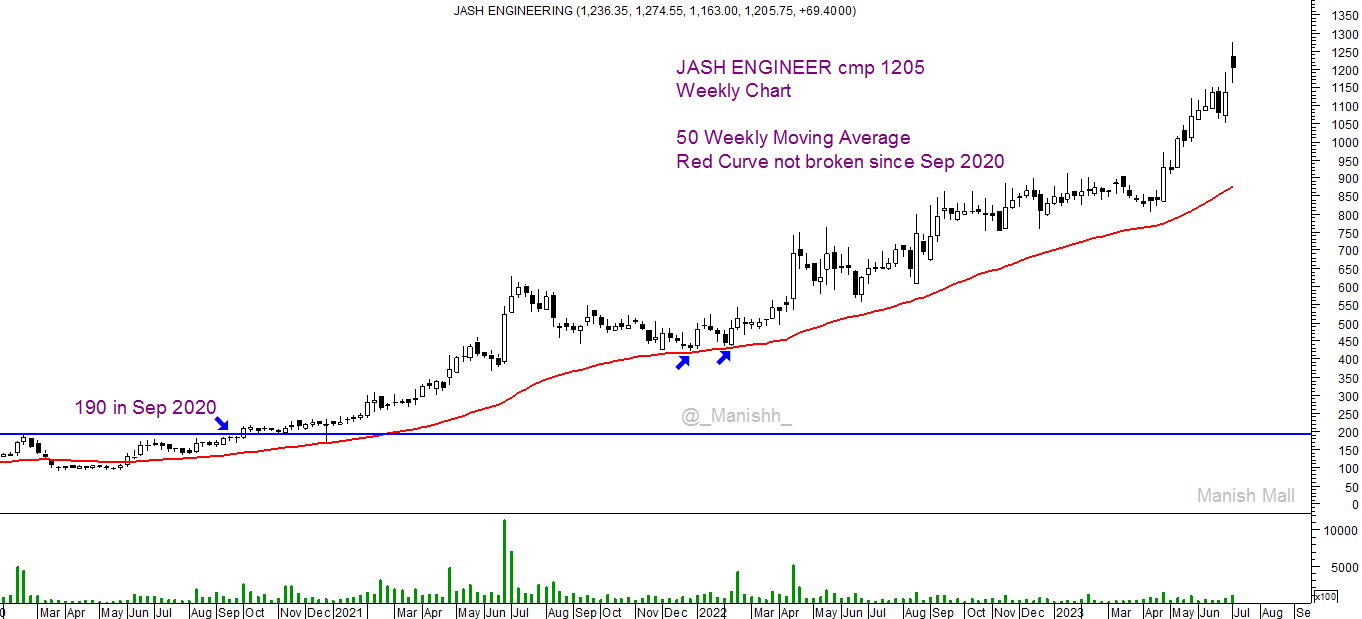
I had earlier posted chart of Jash Engineering around 190 in Sep 2020
and than a follow up chart around 400 , Cmp 1205
Though i have a very small Allocation left now,
was going through the chart today which was without Moving Averages since long time
Today attached 50 WMA ( Red curve ) and was surprised to see how
JASH has not broken this 50 WMA since Sep 2020 after all the Volatility of Markets
in Hindsight if i had this WMA since earlier would have helped in
Riding Full qty , even doing Canslim at times .
Just posting a Chart for Self Learning how one can Technically Ride the trend.
and what’s the Current Fundamental views now
| Subscribe To Our Free Newsletter |
