
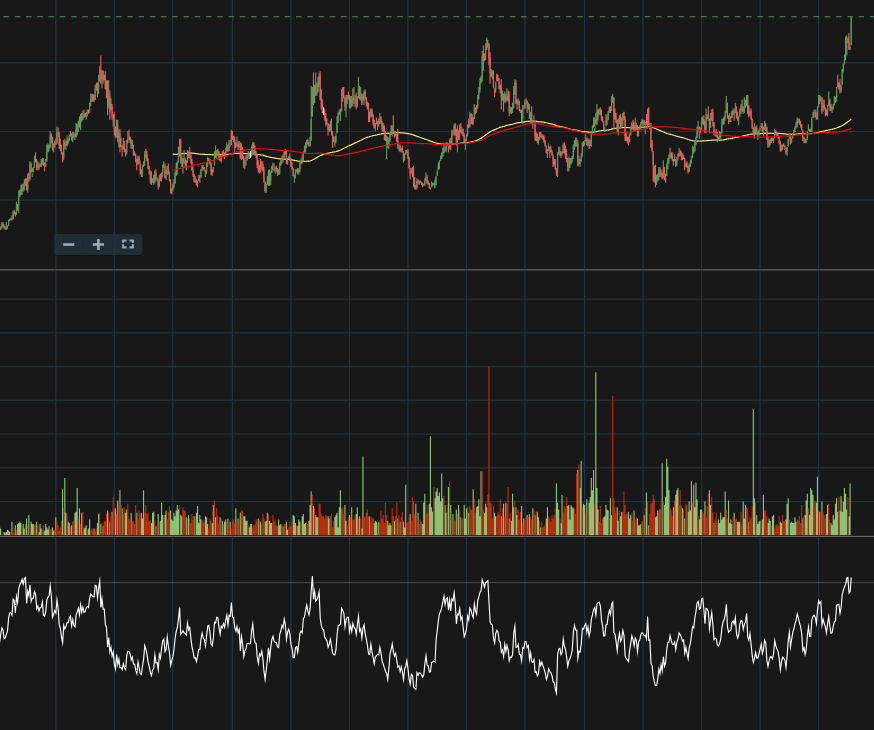
REC Weekly chart attached – this stock has also given a multi year breakout and had consolidated around breakout levels.
The consolidation was however short lived and 2 small symmetrical triangles were observed on weekly charts. Buying volumes have also been good.
On fundamentals side, P/B of REC is on the lower end of its historical average and some level of balancing was bound to happen. I was initially intrigued by its dividends, but later the chart also looked interesting.
| Subscribe To Our Free Newsletter |
