
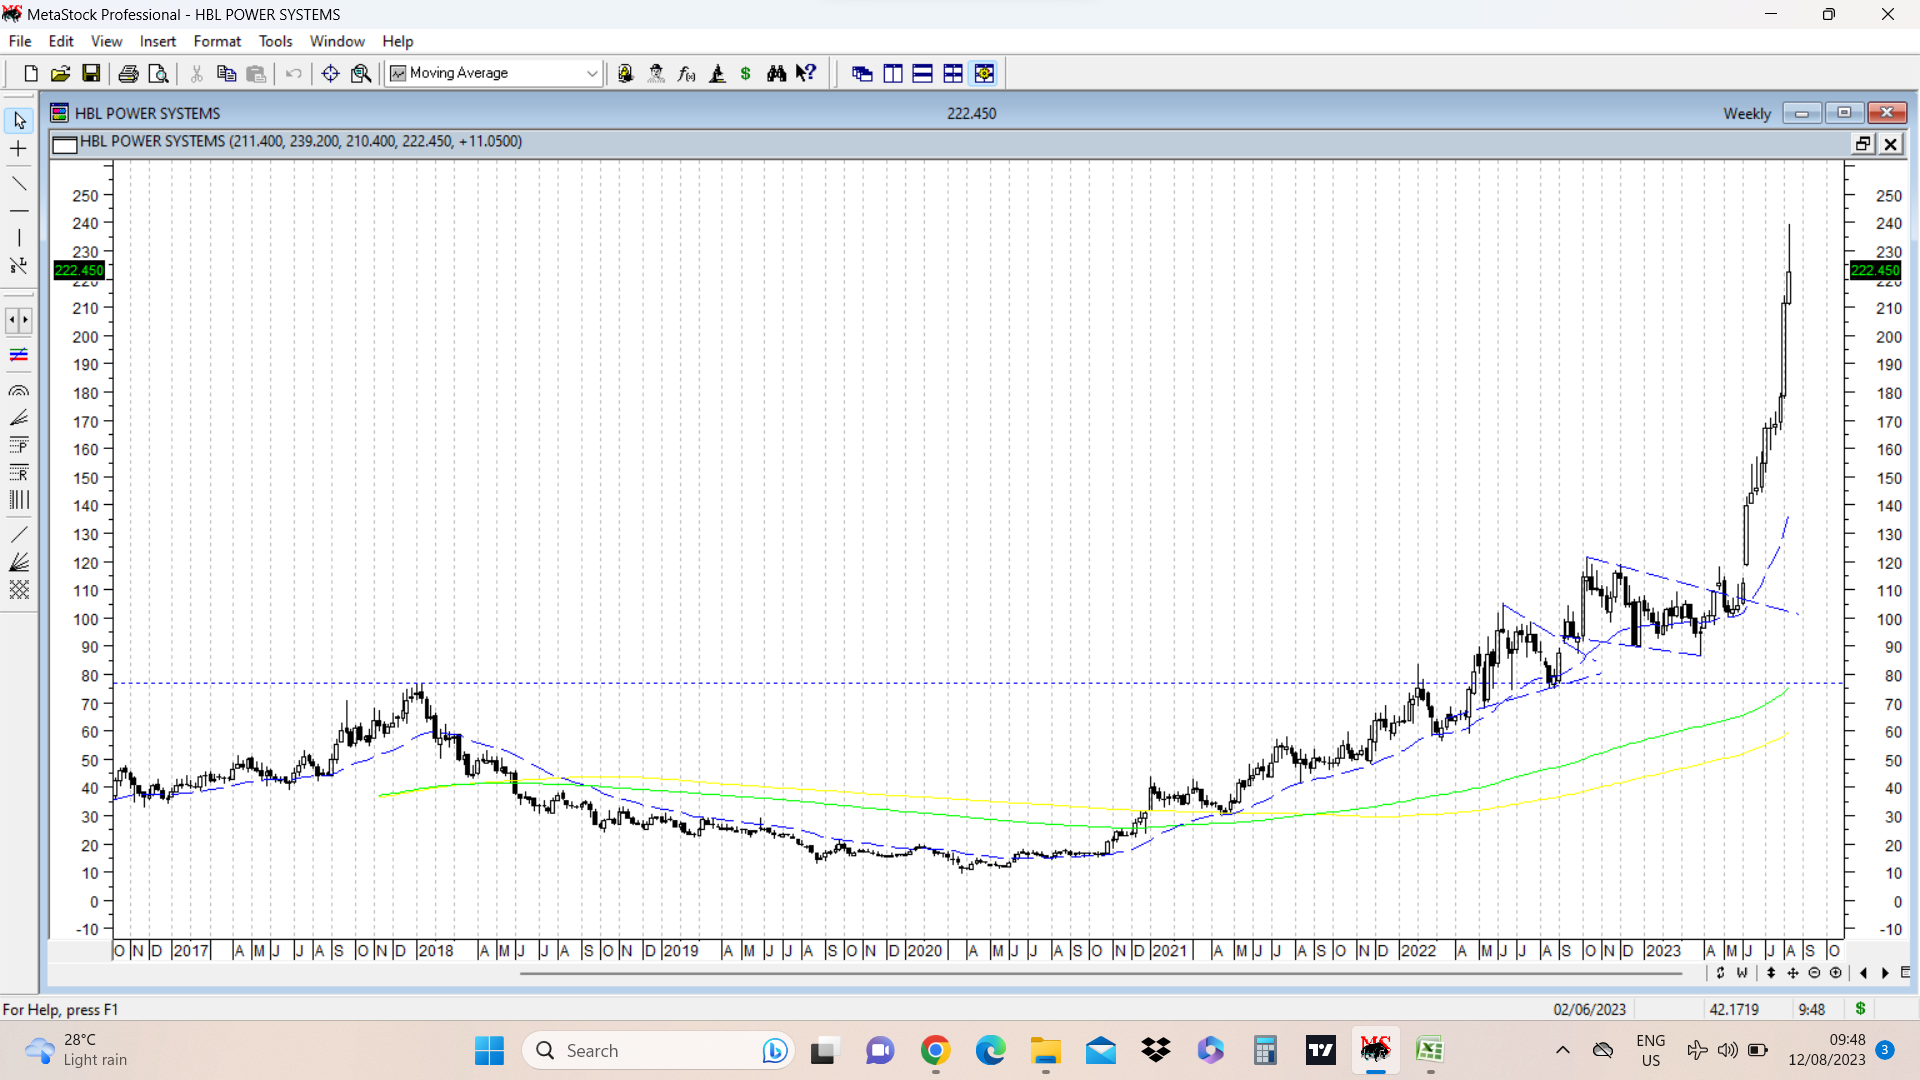
HBL Power weekly candlestick chart posted below. Some important observations till date.
-
A very nice saucer shaped rounding formation took place between Jan 2018 to April 2022. In April 2022, stock price crossed and closed conclusively above previous ATH of 77.
-
Two triangular consolidations after crossing ATH have been marked in dotted blue lines. These are on top of each other. Often similar to a base on top of a base formation referred to by William O Neil.
-
After crossing previous ATH of 77 in April 2022, real big move in the stock price happened in June 2023. It took nearly 14 months of consolidation above previous ATH even after the breakout happened , which goes to show the importance of having patience in these kind of investments. This 14 months period was filled with a lot of doubts about the business and its prospects.
-
After the first time stock price conclusively crossed previous ATH in April 2022, stock price went down and retested breakout levels and touched levels of 67 in May 2022, and around 74-75 in June 22 and August 22. This is an important learning and can be used in the future in case of stocks breaking out past previous ATH with a nice rounding bottom formation, and good business prospects. ( initially after the breakout for a few weeks and months, the fundamental picture is often hazy and murky, but this is the time to do proper homework fundamentally. )
-
Stock price gapped up between 114-118 on daily and weekly charts in June 2023 and since then doubled in quick time. This explains the importance of breakaway gaps.
-
This week results were out and have been quite good. On daily charts, stock has gone sideways, and weekly candle shows a long upper wick with a high at 239. Low for the week remains at 211 which is the high of previous week’s big bull candle. Going ahead, these levels of 211 and 239 assume a lot of significance in terms of breakout or breakdown.
| Subscribe To Our Free Newsletter |
