
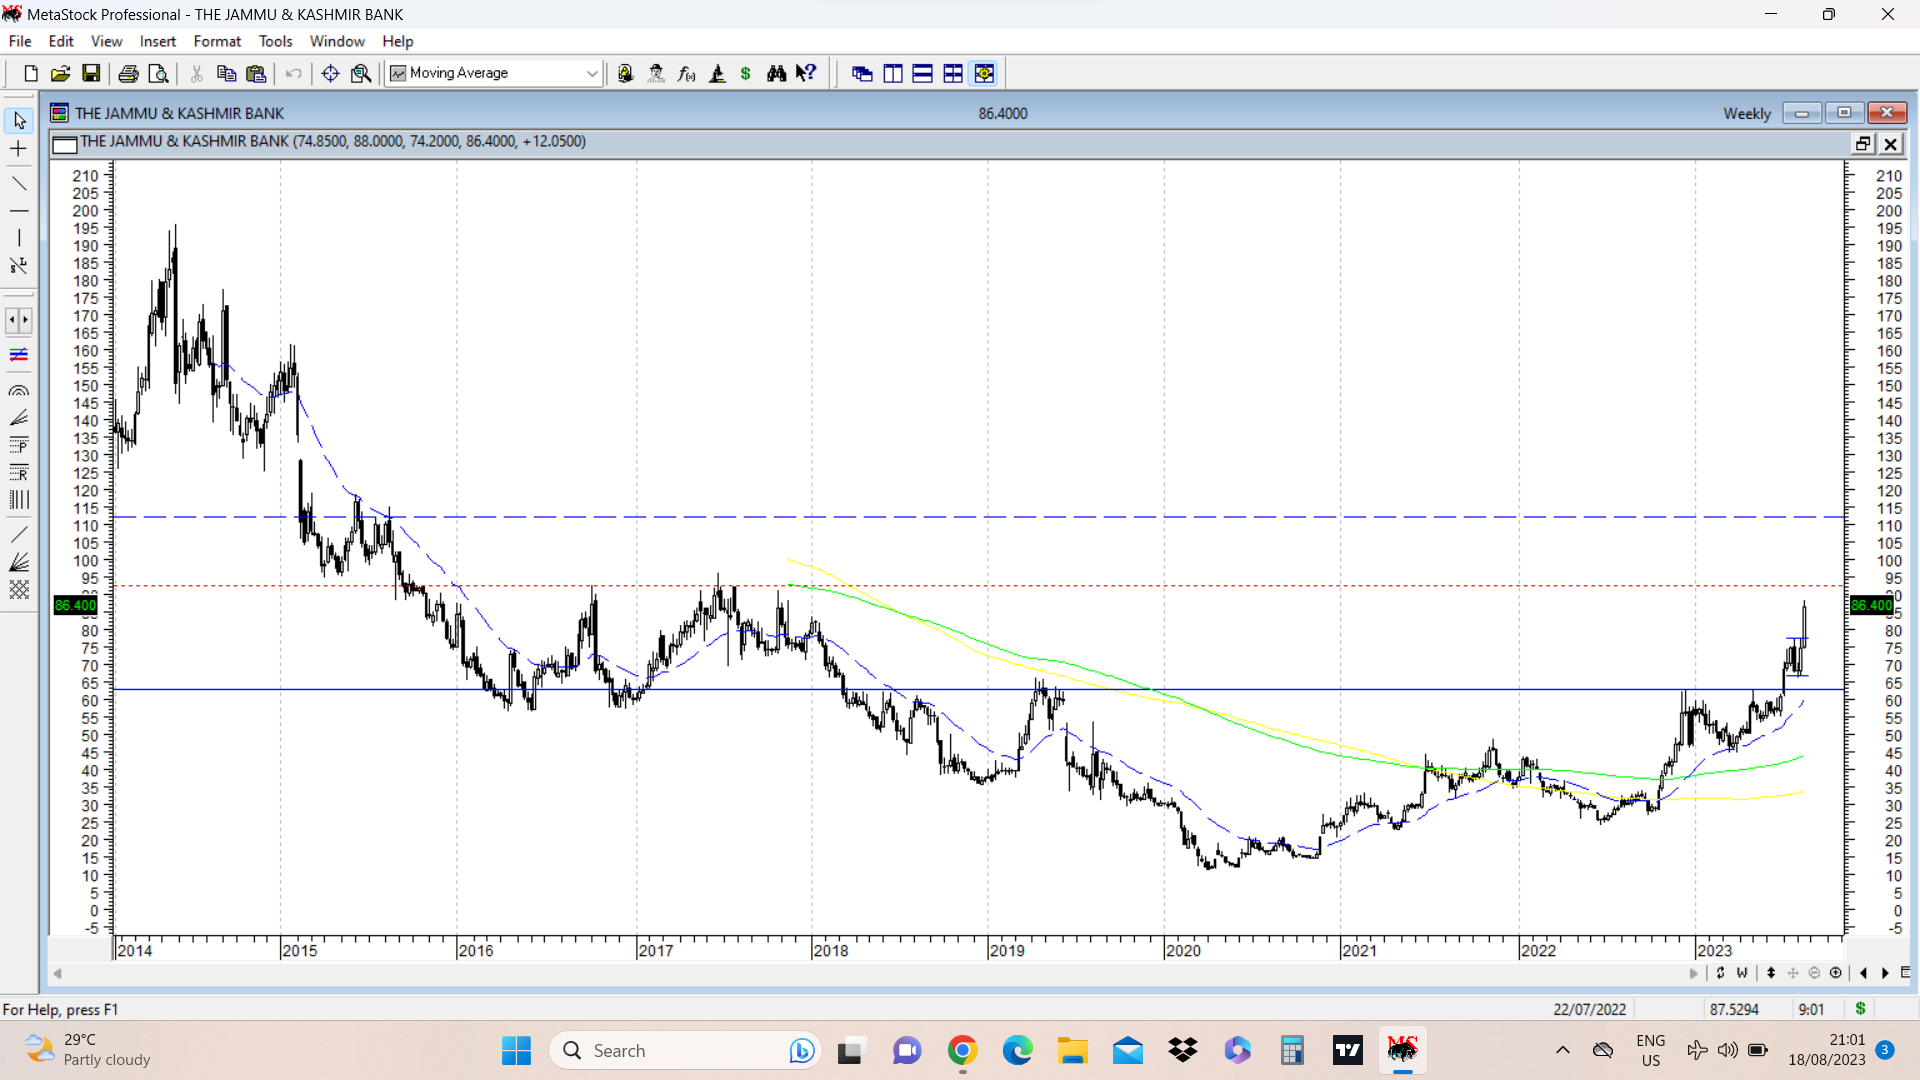
J&K bank follow up to the chart posted above. The stock price this week gave a strong close with a big bullish candle and a breakout above a 5 week range between 66-77 marked in dotted blue lines. Near term resistance is marked in dotted red lines at around 92. Above that next major resistance is around 110-115.
This chart is an example of early stage rounding bottom and if that pattern plays out then ultimate targets can be its previous life highs of 195 and above that could be a blue sky scenario. Needs to be seen how it plays out as there can be hurdles on the way up even in rounding bottoms.
| Subscribe To Our Free Newsletter |
