
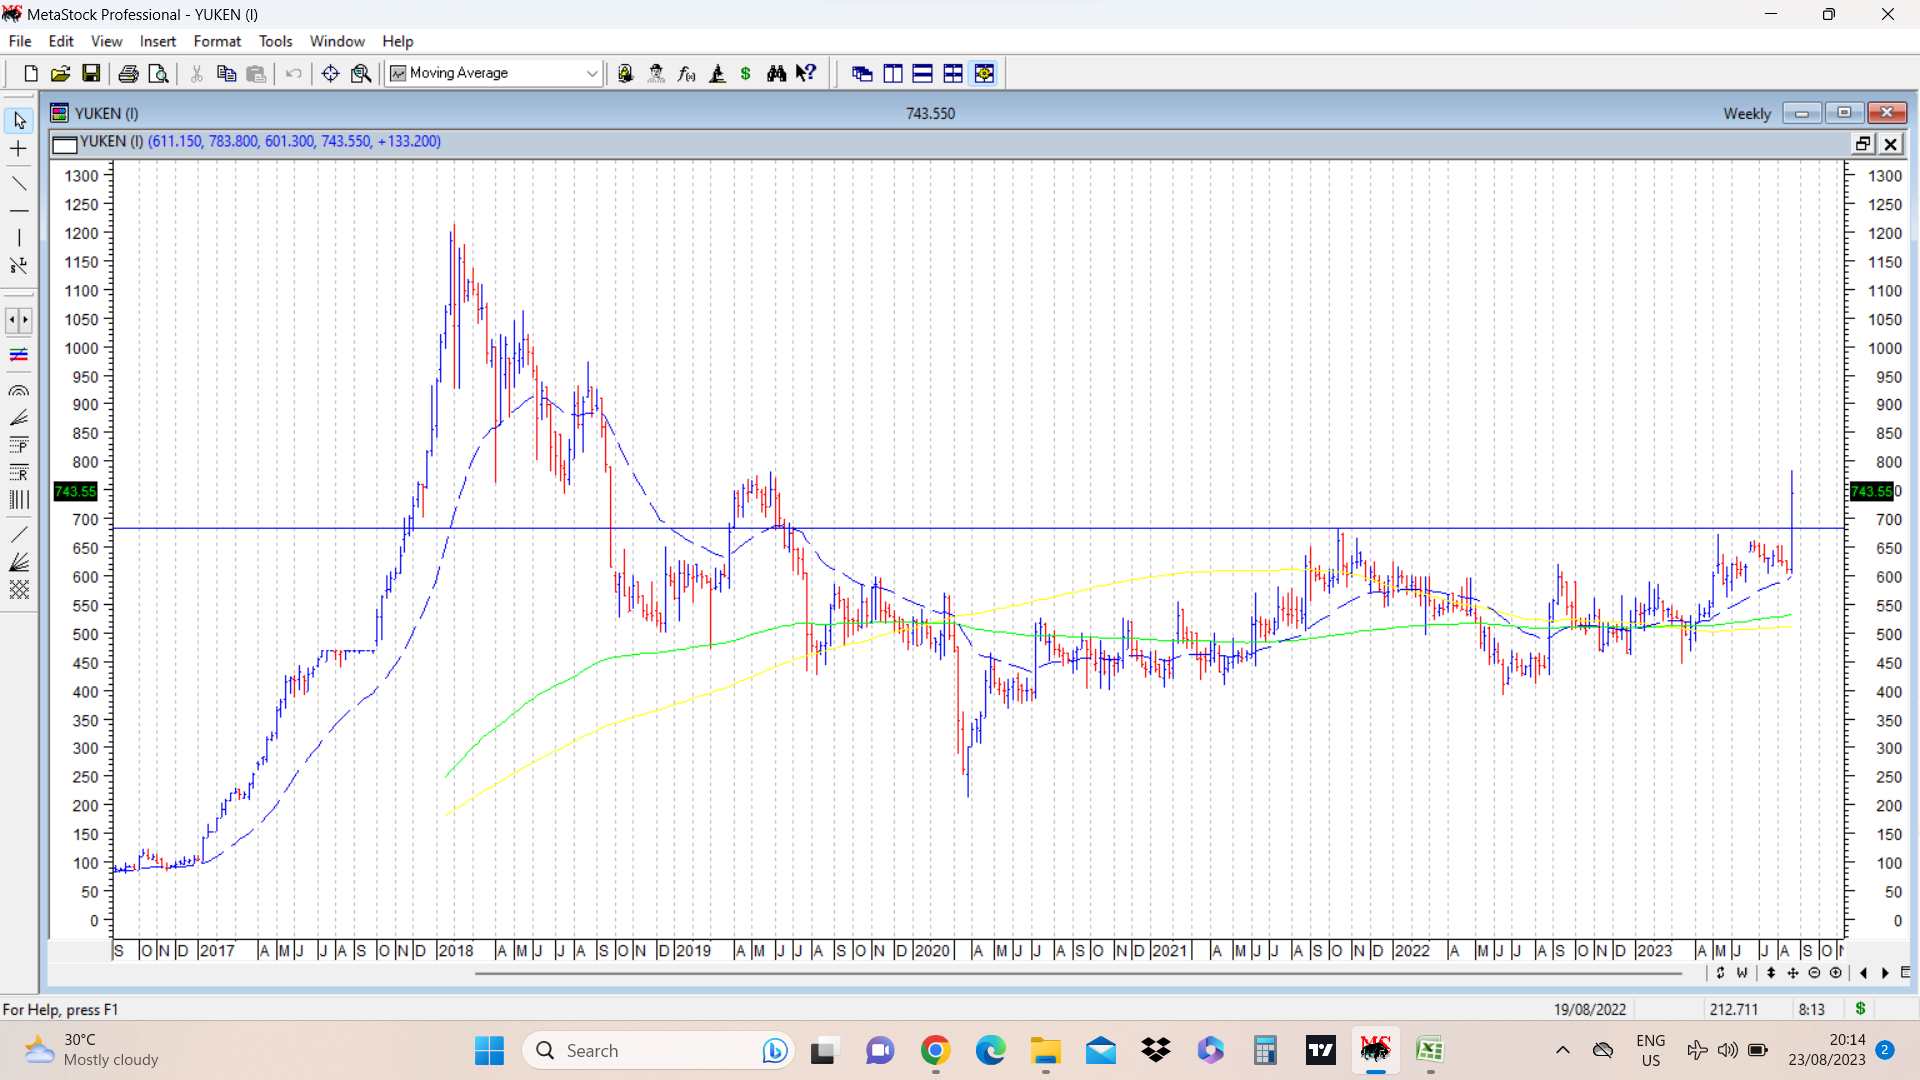
Attached Yuken India chart shows a breakout from (as you said) 4 year high resistance at 684. There is a nice rounding saucer shaped structure, so overall chart looks bullish. But fundamentally I cannot see much encouraging if I look at the results for the last few years. So one needs to be careful jumping the gun and going full throttle. Maybe going through annual report, AGM recording (if available) or doing scuttlebutt, looking at the products of parent company etc could help. I don’t track it fundamentally or know about its products or their prospects.
If at all one wants to look at it based on charts, its best to wait for a retest of breakout zone and then take a call. If it does not come down and keeps running up, then better look out for something else.
(PS… Someone started a whole thread about a company on this portfolio thread and I had to delete it. If you want to start a thread on a company, please start it at an appropriate place)
| Subscribe To Our Free Newsletter |
