
Read about the business and sharing the notes below since price chart had optimism.
Investor Presentation, 29th April, 2023
- Revenue Mix (FY23) Bi-Metal Products: 73% Aluminum (Alkop): 27%
- 30% Export Revenue
- Revenue from exports declined due to slowdown in exports to Japan for bimetal products, which we anticipate to normalize in the coming quarters
- As our products are gaining more recognition, our share of sales through OEM’s is up significantly in the last 2 years [Up by 70%]
- In house Machine Building Capability to Design SPM, Tooling, Gauges & Fixtures, and Tool Room for faster Development. Significant savings in Cost and competitive advantage over peers
- Catering to Industries & Applications which will have low impact from change in shift to Electric Vehicles | Long standing relationship with potential EV players to cater in Future
Q4 FY ’23 Earnings Call May 02, 2023 [first earnings call]
General:
- Management: ARUN ARADHYE – WTD AND CFO
- 100% sure to grow at least by 20%
- Capex: 30 crores by FY25 | see the business on the horizon | internal funding with marginal debt | 60% for Aluminum and 40% to bi-metals division| Post capex revenue potential will be ~400 Cr.
- Started in 1994, 3 mfg. plants at Kolhapur, & 1 warehouse in USA | Export 24+ countries | 1,000 dealers/distributors & 10,000 retail outlets across India | No single customer > 10% of revenue.
- In-house machine building and tooling capability. Products have long and highly collaborative development cycles, require testing and validation and critical in nature, requiring high gestation period for supply approvals. High entry barrier in the industry | Limited number of players
- EBITDA margin improved because of more exports and value-added products. Sustainable even after realizing full revenue potential, considering lower margins of brakes business.
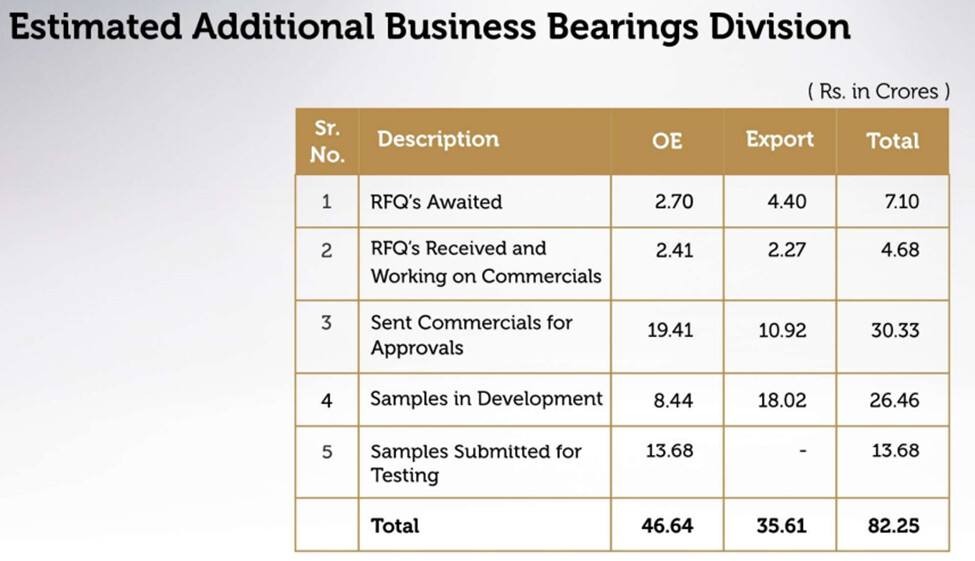
- RFQs conversion rate ~ 80% to 85% | Timeline of 10 months from the receipt of RFQs to actual start of business | RFQs à samples à commercials à audits. à Samples for testing
- Exports 100% auto- HGV, LCV | Exports margins~ 3% to 4% more than overall margins.
- Policy to declare 40% of the PAT as a dividend.
- Segments: Tractor 30% | HGV 20% | Brakes 17% | Transmission 10% | Replacement 8% | Raw material and strip supplies 12% | Others 3%. Brakes & Transmission- Supply to Brakes India or Automotive Axles.
1. Bi-metal division:
- Components: bearings, bushes, and thread washers for engines
- 80% is auto | Installed capacity per Annum 516 lakh units | Utilization ~ 70%
- Mkt Size: Domestic – 1,000Cr (market share of 20% to 25%) | Exports – INR6,000 crores.
2. Aluminum (Alkop) Die-Cast division:
- ~ 50% is auto | better scope for growth due to customization needs
- In FY23, revenue growth ~29% versus the volume growth of 6% due to new products and accepting critical components, low volumes but high value
- Installed capacity per Annum 1,440 metric tons | Utilization ~ 70%
- Mkt Size- 6,000Cr. for auto and non-auto (refrigerators, pumps, oil, and gas pipelines)
3. Brakes Segment:
- New Segment | Started from Q1FY24 | Capex of 8 Cr for a revenue potential of 25Cr. | EBITDA margins 18%~19% | Brake shoe and lining for L/HCV | Replaced every 15,000 ~ 40,000 kms.
- Installed capacity per Annum – 15 lakh units for liners, and 2.4 lakh units for shoes
- Mkt Size- 4,000Cr. Out of that 900 Cr. replacement mkt
- Limited competition | 1st target aftermarket using existing network and later OEMs.
- Additional growth will require nominal capex. Additional line costs ~2 crores
- key competitors- Rane Brakes and Hindustan Composites
- Will take six months to develop market | Intend to reach 100 cores business within three years.
AGM Presentation, 27th July, 2023:
Observations from the FY23 AR:
- MD 80 Yrs. Old | Executive Chairman – Key Person. I sense that he is grooming son who is working as Assistant to the Chairman
- Sales to Related Party: 23% of sales in FY17 | 14 % of sales in FY23
Financial Statement Observations:
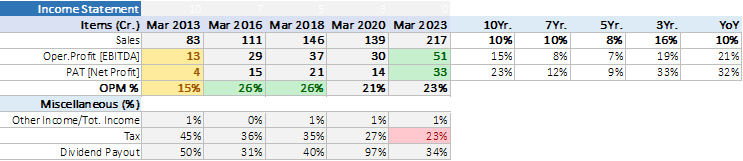
1- Sales, Operating Profit and PAT alongwith their CAGR:
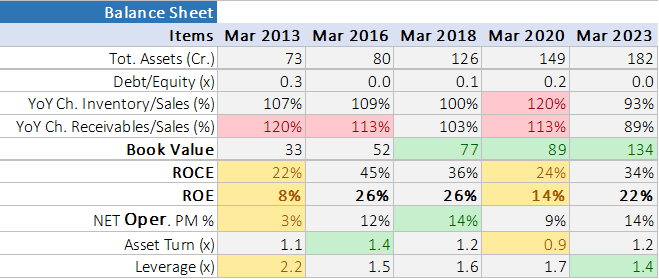
2- Balance sheet with Key Indicators:
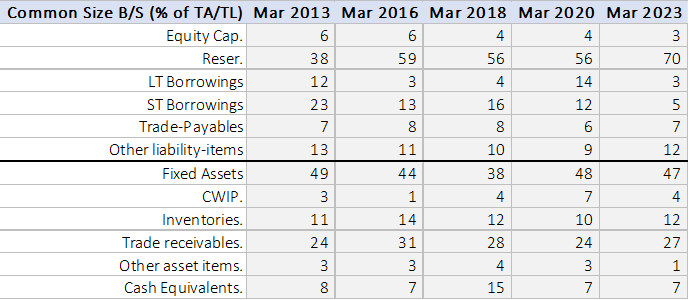
3- Sources of Funding and Usage of Funds:
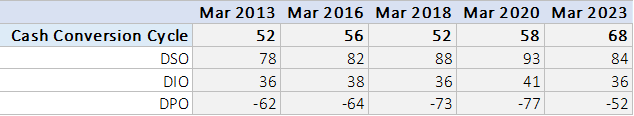
4- Cash conversion Cycle:
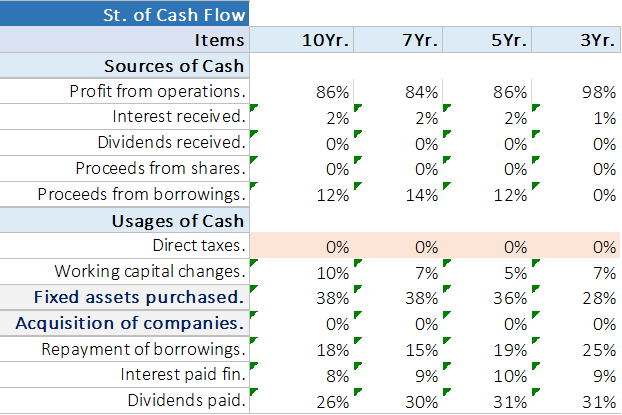
5- Sources and Usage of Operating Cash flows: Statement of Cash flow does not list paid taxes. However, the statement starts with PAT instead of PBT (common practice). I think that the business does pay taxes and the entry is missing only in the statement of cash flow. Who can dare to reward the shareholders in the form of dividends but ignore the government?
Valuations:
Currently at the upper end of the historical valuations range. With 2-year fwd. horizon and expected growth and OPM, valuations seem fair.

Conclusion:
A good business to track but not a good investment at this juncture due to prevailing valuations compared to historical valuations, considering expected growth and OPM of next couple of years.
Data Source: Screener, Company’s Public Filings
Disc: No position. Shared for collabrative learning.
| Subscribe To Our Free Newsletter |
