
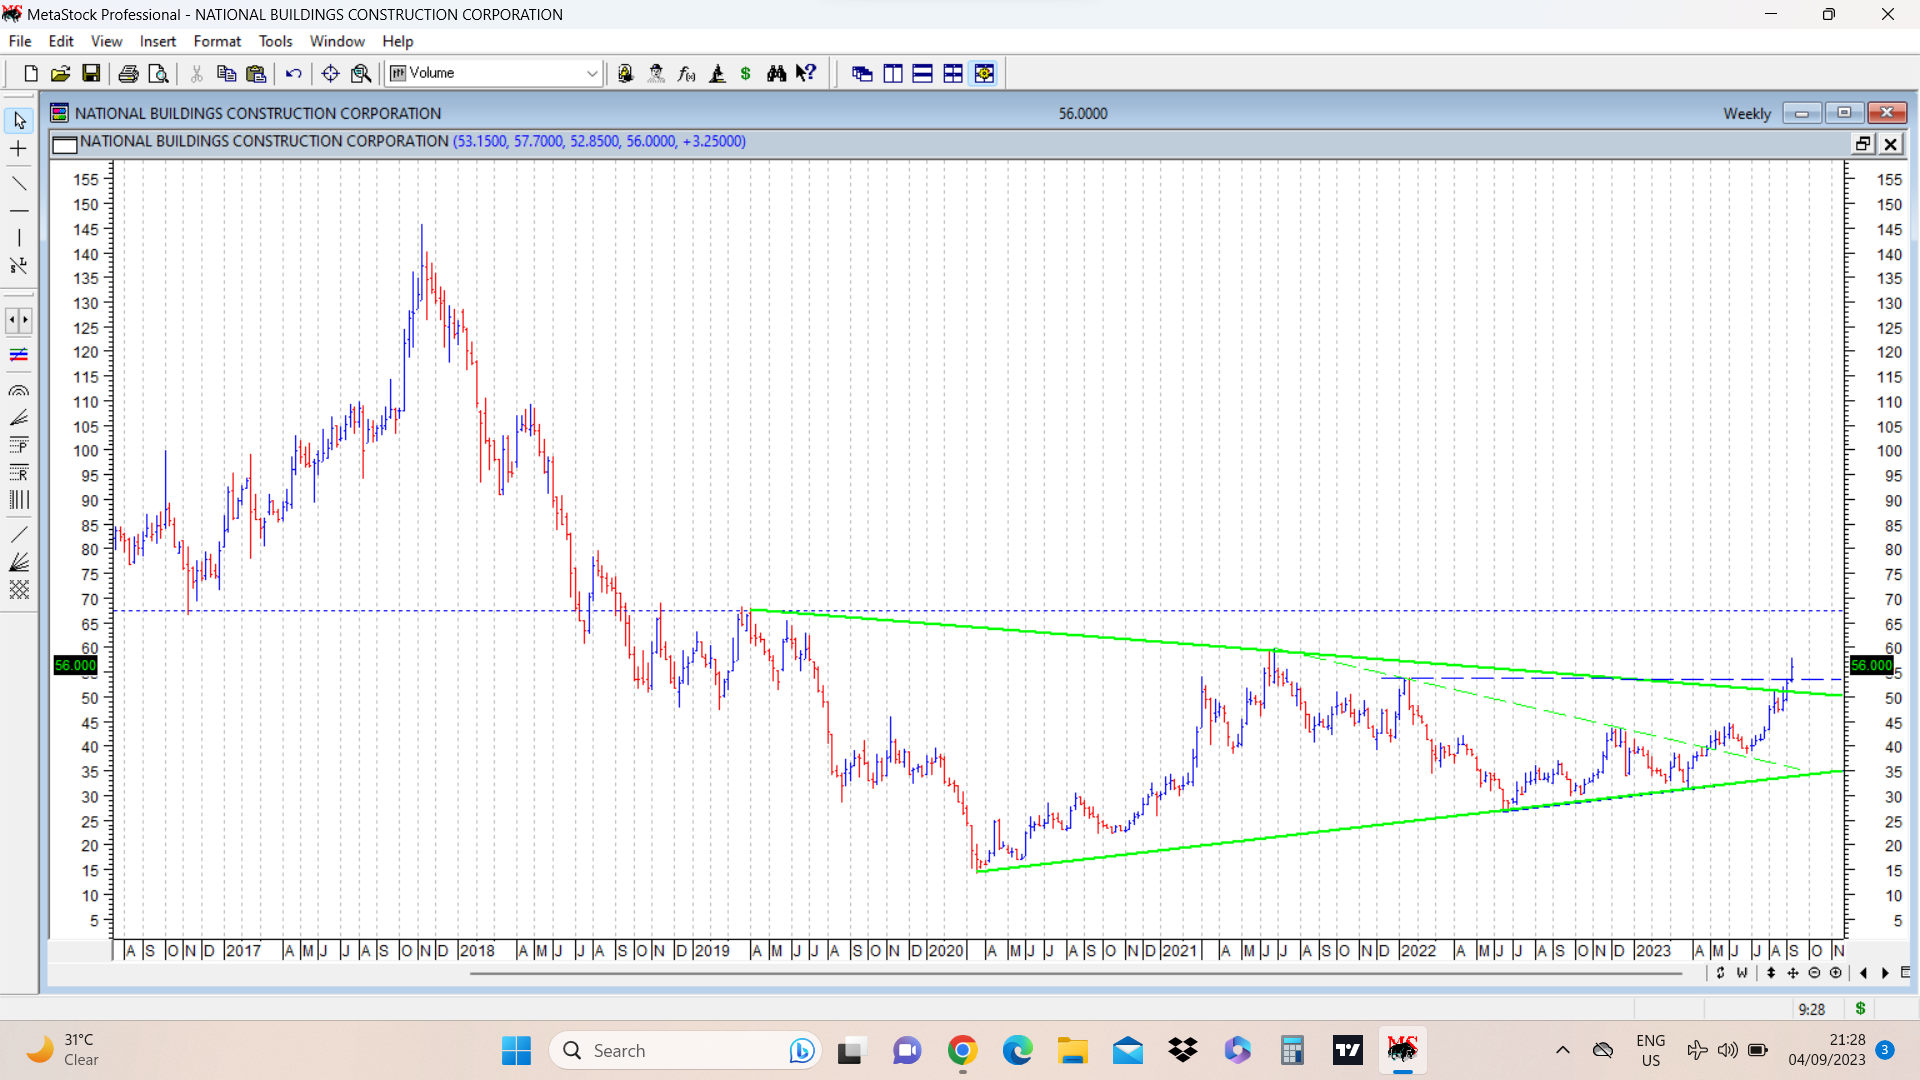
NBCC today made a fresh breakout from its consolidation and crossed a 52 week high level of 53, closing close to 56. Attached chart shows a triangle within a triangle pattern. Solid green lines show the larger symmetrical triangle and a dotted green line represents a smaller triangle wtihin it. Dotted blue line is a 52 week high line near 53. Next destination/resistance can be 68 (dotted blue line) which would be a 5 year high level.
disc: invested. It’s very interesting to see patterns different from the routine cup and handles, inverted head and shoulders, or others like 52 week high or multi year highs. Here its triangles.
| Subscribe To Our Free Newsletter |
