
I have joined this esteemed forum last week, thus I had an opportunity to see various charts being posted on this thread. I saw some charts with ‘cup with handle’ pattern. So, thought of sharing one of an old chart wherein this pattern was formed.
Mr. William J. O’Neil’s in one of his best sellers explained this pattern. Thus, it is a small effort to bring out his book’s points vis-a-vis the description in the instant chart :
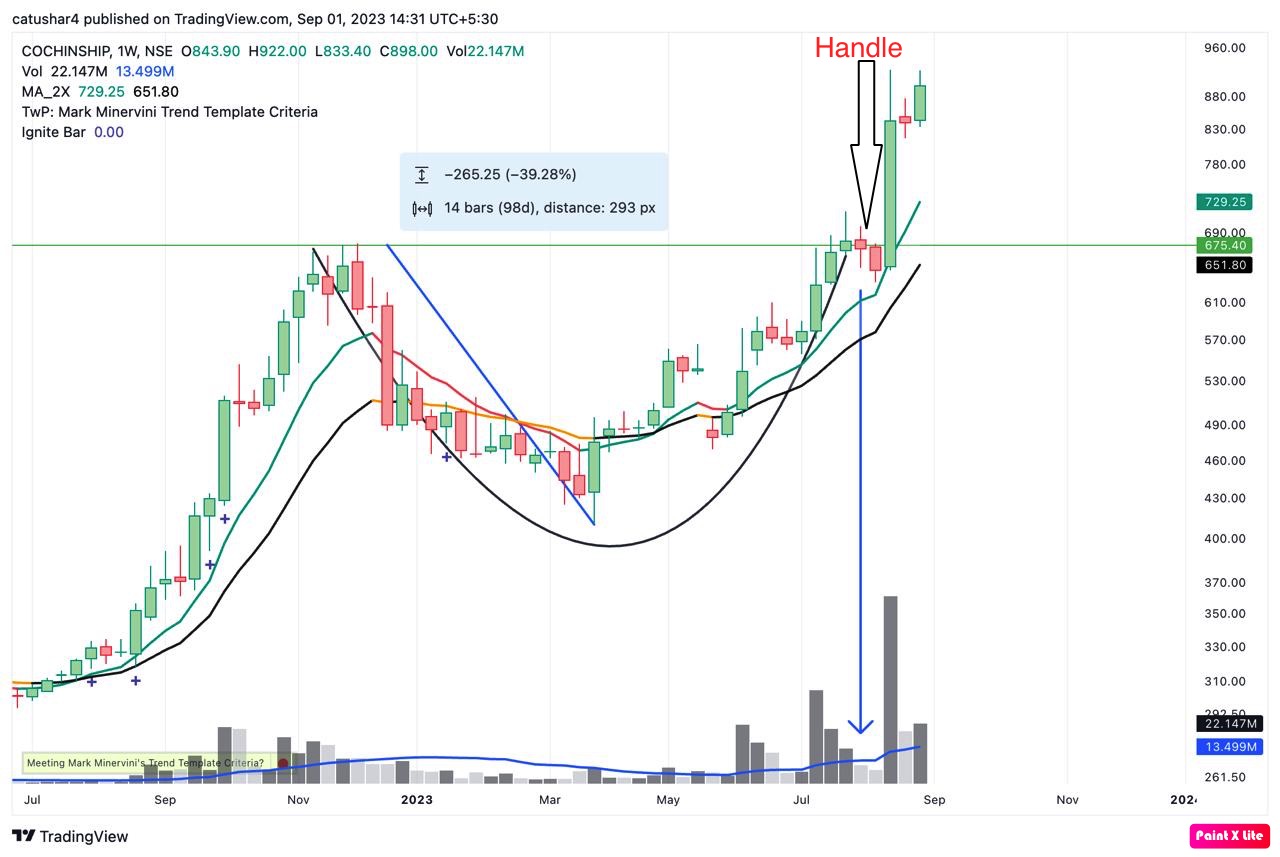
- The depth should range from to the low of 12 to 15% range to upwards of 33%. However, in the chart it is around 39%.
- Pattern must form a ‘U’ (ranging from 7 to 65 weeks) to make sure that weak hands are out of the stock. Also, it do not come to the attention of the speculators. In the given chart the U is of 35weeks.
- The handle of the cup should take more than one or two weeks to form and should have a ‘shakeout’. In the chart the handle took 2 weeks with shakeouts.
- Volumes may be dried up near the low’s in the handle’s price pullback phase. Observe the volumes in the chart (marked it with blue arrow).
- Lastly, and a very important pointer to keep in mind is that the handle should be above the stock’s 10 WMA, as the handles that forms completely below the stocks 10 WMA are weak and failure-prone. Further, the wedging up or the side way handles have a much higher probability of failing when they break out to a new high. In the given chart the ‘Green” curve is of 10 WMA.
| Subscribe To Our Free Newsletter |
