
Update:
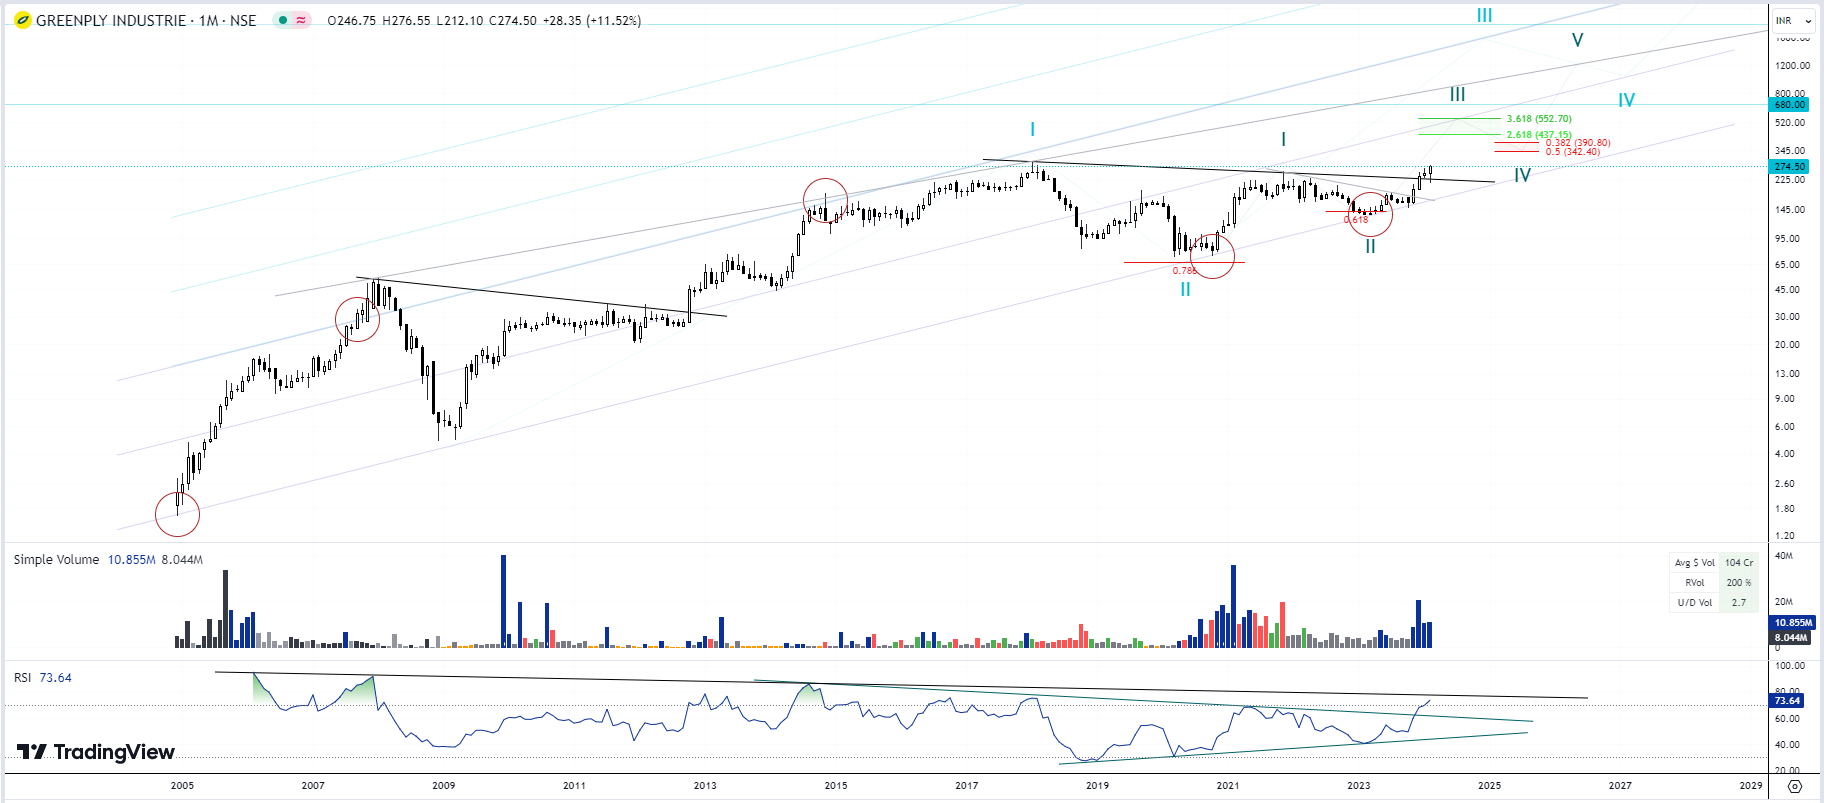
GREENPLY INDUSTRIES – Monthly Chart: 186 – 275;
- A smaller slant breakout played out, volumes have risen in weekly chart, with increasing deliveries.
- A Multi year channel being respected
- RSI breakout done
- Previous Slant breakout in 2012 led to a bull run in the stock.
- Similarity in setups from 2007-12 and currently from 2018 Jan top to 2023
Safe to assume bullish bias ahead, with bigger slant breakout leading to large up moves.
| Subscribe To Our Free Newsletter |
