
Gujarat Flurochem Daily
The Guj Flurochem thread has the neccessary fundamental points. From a technical point of view there are several things that have happened at once in the chart – as follows :-
-
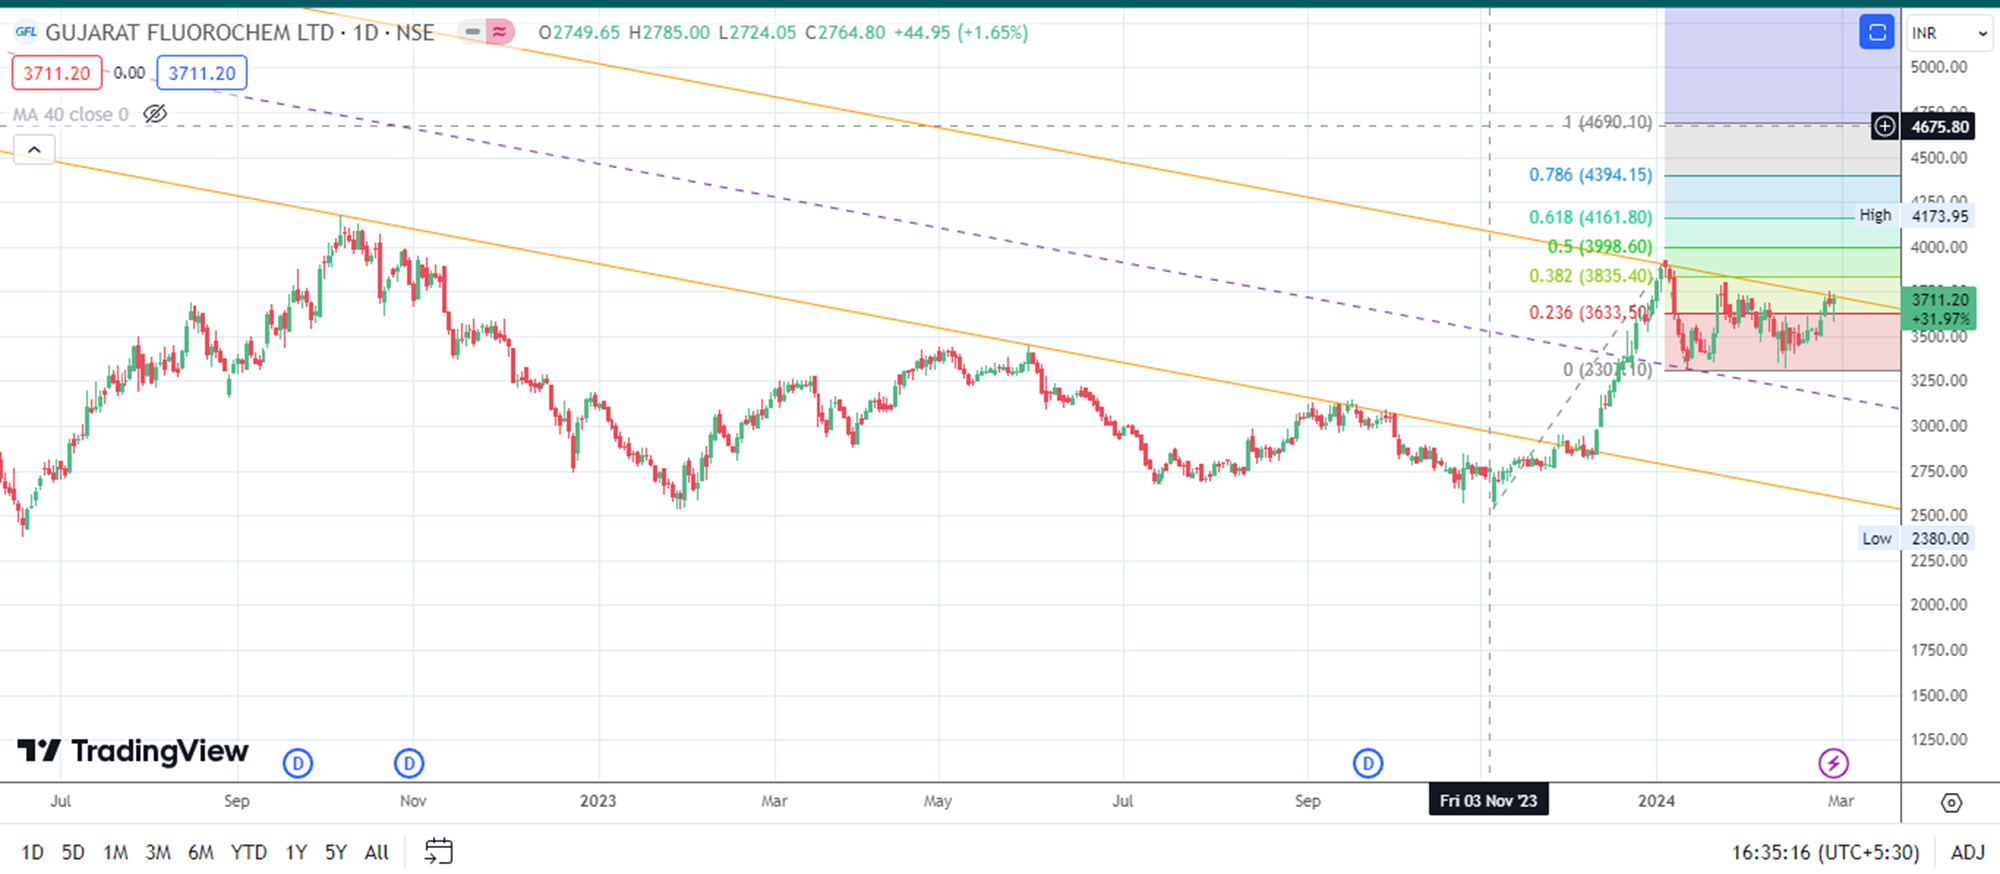
After breaking out of a downward sloping channel @ 2949 the stock price rallied by roughly 1000 points posting a high of 3920. This incidentally is also the size of the parallel channel formed within which stock prices are moving. In the event prices break out of this channel from 3711 then there is a potential upmove of roughly 1000 points to reach roughly 4700
-
There are also a couple of continuation patterns that are clearly visible on the chart viz a flag pattern/triangular consolidation with a pole size of 1000 points and the flag being restricted in the top 38.2% of the pole size and price also rebounding of the support of 3391 i.e the 38.2 fib retracement level several times. The second pattern is a shallow cup and handle which is a good indication of a possible upmove.
-
The third one is the theory that the size of a previous upmove as calculated from the intervening retracement is duplicate the the successive upmove. Prices moved from a low of 2537 to a high of 3920 – a move of 1383 points which added to the intervening retracement of Rs 3307 would amount to 4690 (3307+1383) which also is the target in point no 1 i.e roughly 4700
-
The chart posted a hammer candlestick today during the formation of a cup. Hammers are thought to indicate a oissble reversal according to theory.
The stock price has remained resilient even in todays rout indicating strength as well
Disc – invested and no activity in the last 6 months
| Subscribe To Our Free Newsletter |
