
Whenever a stock approaches a major resistance (52 week high or multi year high or all time highs)
In some cases it can breach through the resistance straightaway, and keeps going up. But usually after going some distance, it tends to take a pause, consolidate, or retrace back to breakout levels and undergo a retest. Or
In most cases it tends to consolidate within a tight range above or around the resistance level. And after enough consolidation has happened, it breaks out to higher ground. Or
The breakout fails and the stock price falls back from there and goes down a lot.
All these possibilities have to be borne in mind. That is where the fundamental analysis comes into picture. And the overall market sentiments also matter.
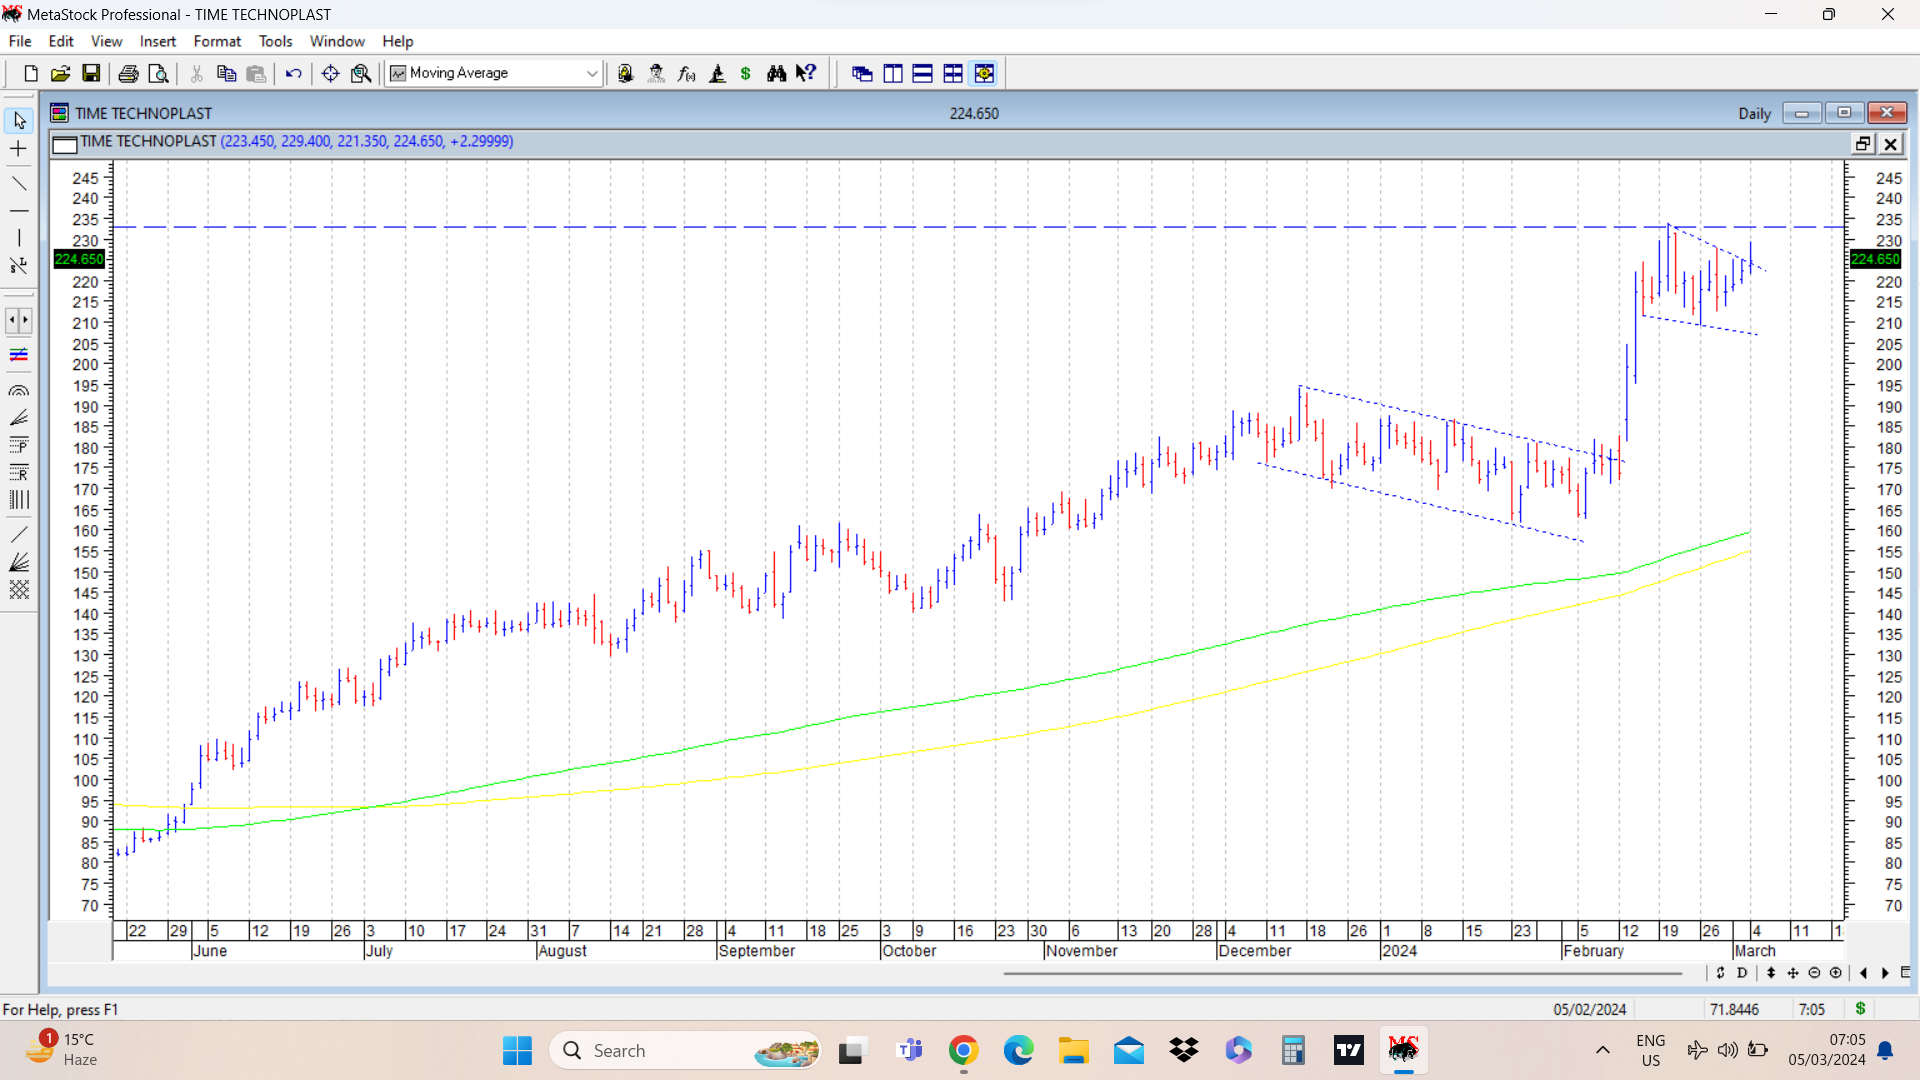
In case of Time techno, it crossed its previous ATH by a small margin and has been consolidating marginally below the previous ATH in a sort of triangular consolidation. This can happen in a lot of similar situations near previous major resistances. You can keep on observing charts where stocks have approached major resistances and see how they have behaved.
Attached daily chart of Time techno shows a consolidation in form of flag/triangle just below previous ATH. Also note a previous consolidation marked in the chart in form of a flag.
| Subscribe To Our Free Newsletter |
