
Just an observation–
For the people who are wondering whether correction is over ?
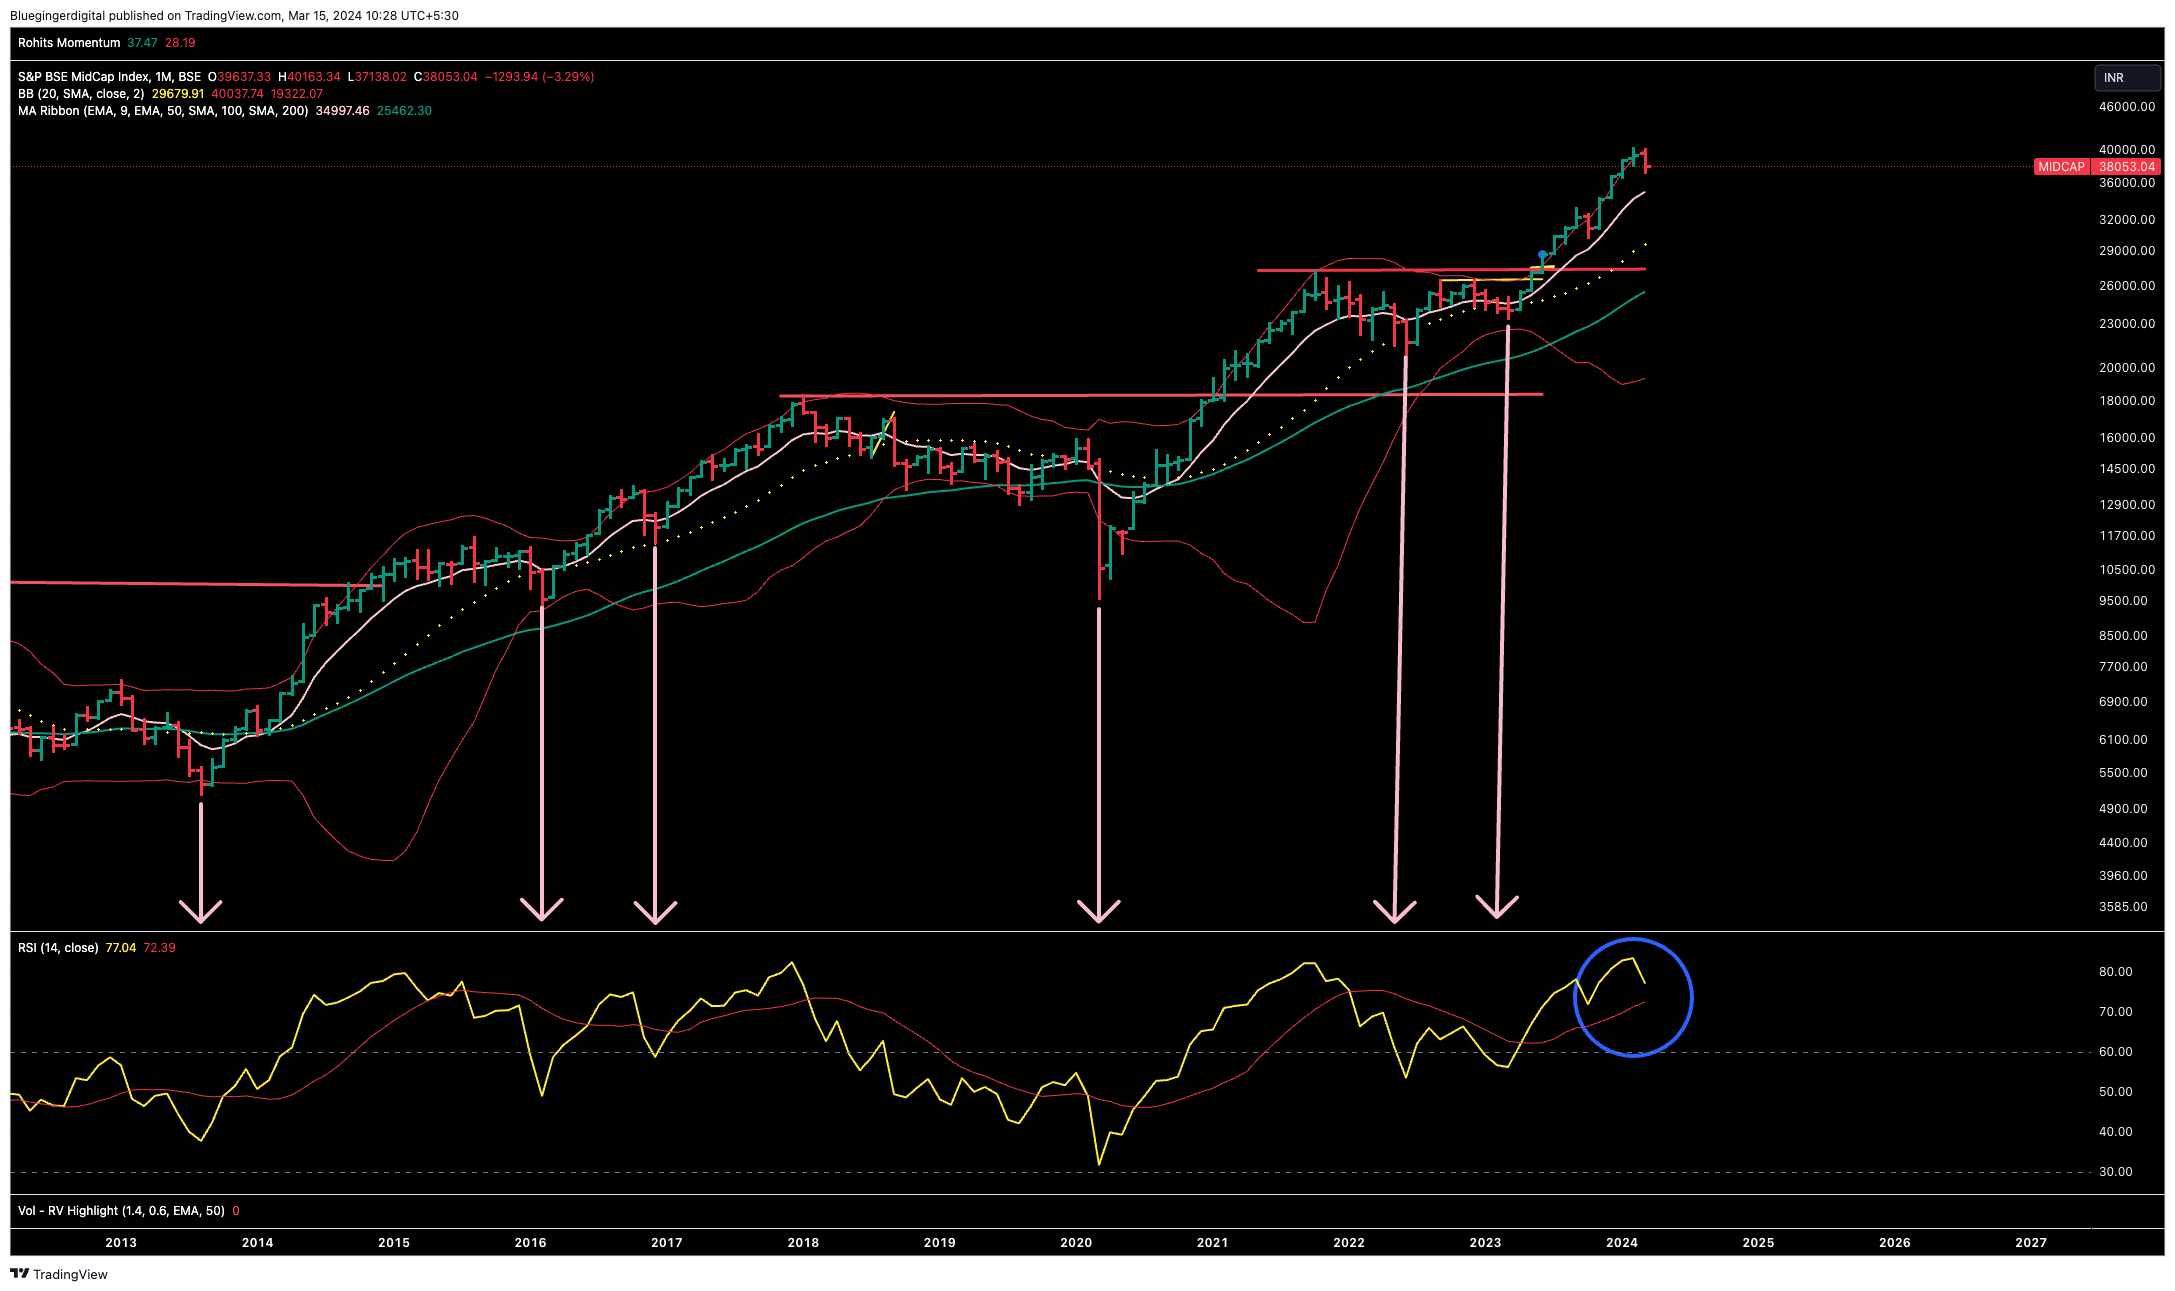
In the past few years , whenever Midcaps started their next leg of MAJOR rally after correction, the index monthly RSI was below 60 or touched 60 and bounced back . Currently it is at 76 ( an exception was there in Oct 23).
This ia BSE Mid Cap chart is from 2013 onwards .
Same thing you can view at BSE Small Cap Index Monthly chart . This may not prove true this time but as they say history does not repeat but it rhymes.
| Subscribe To Our Free Newsletter |
