
AVG Chart
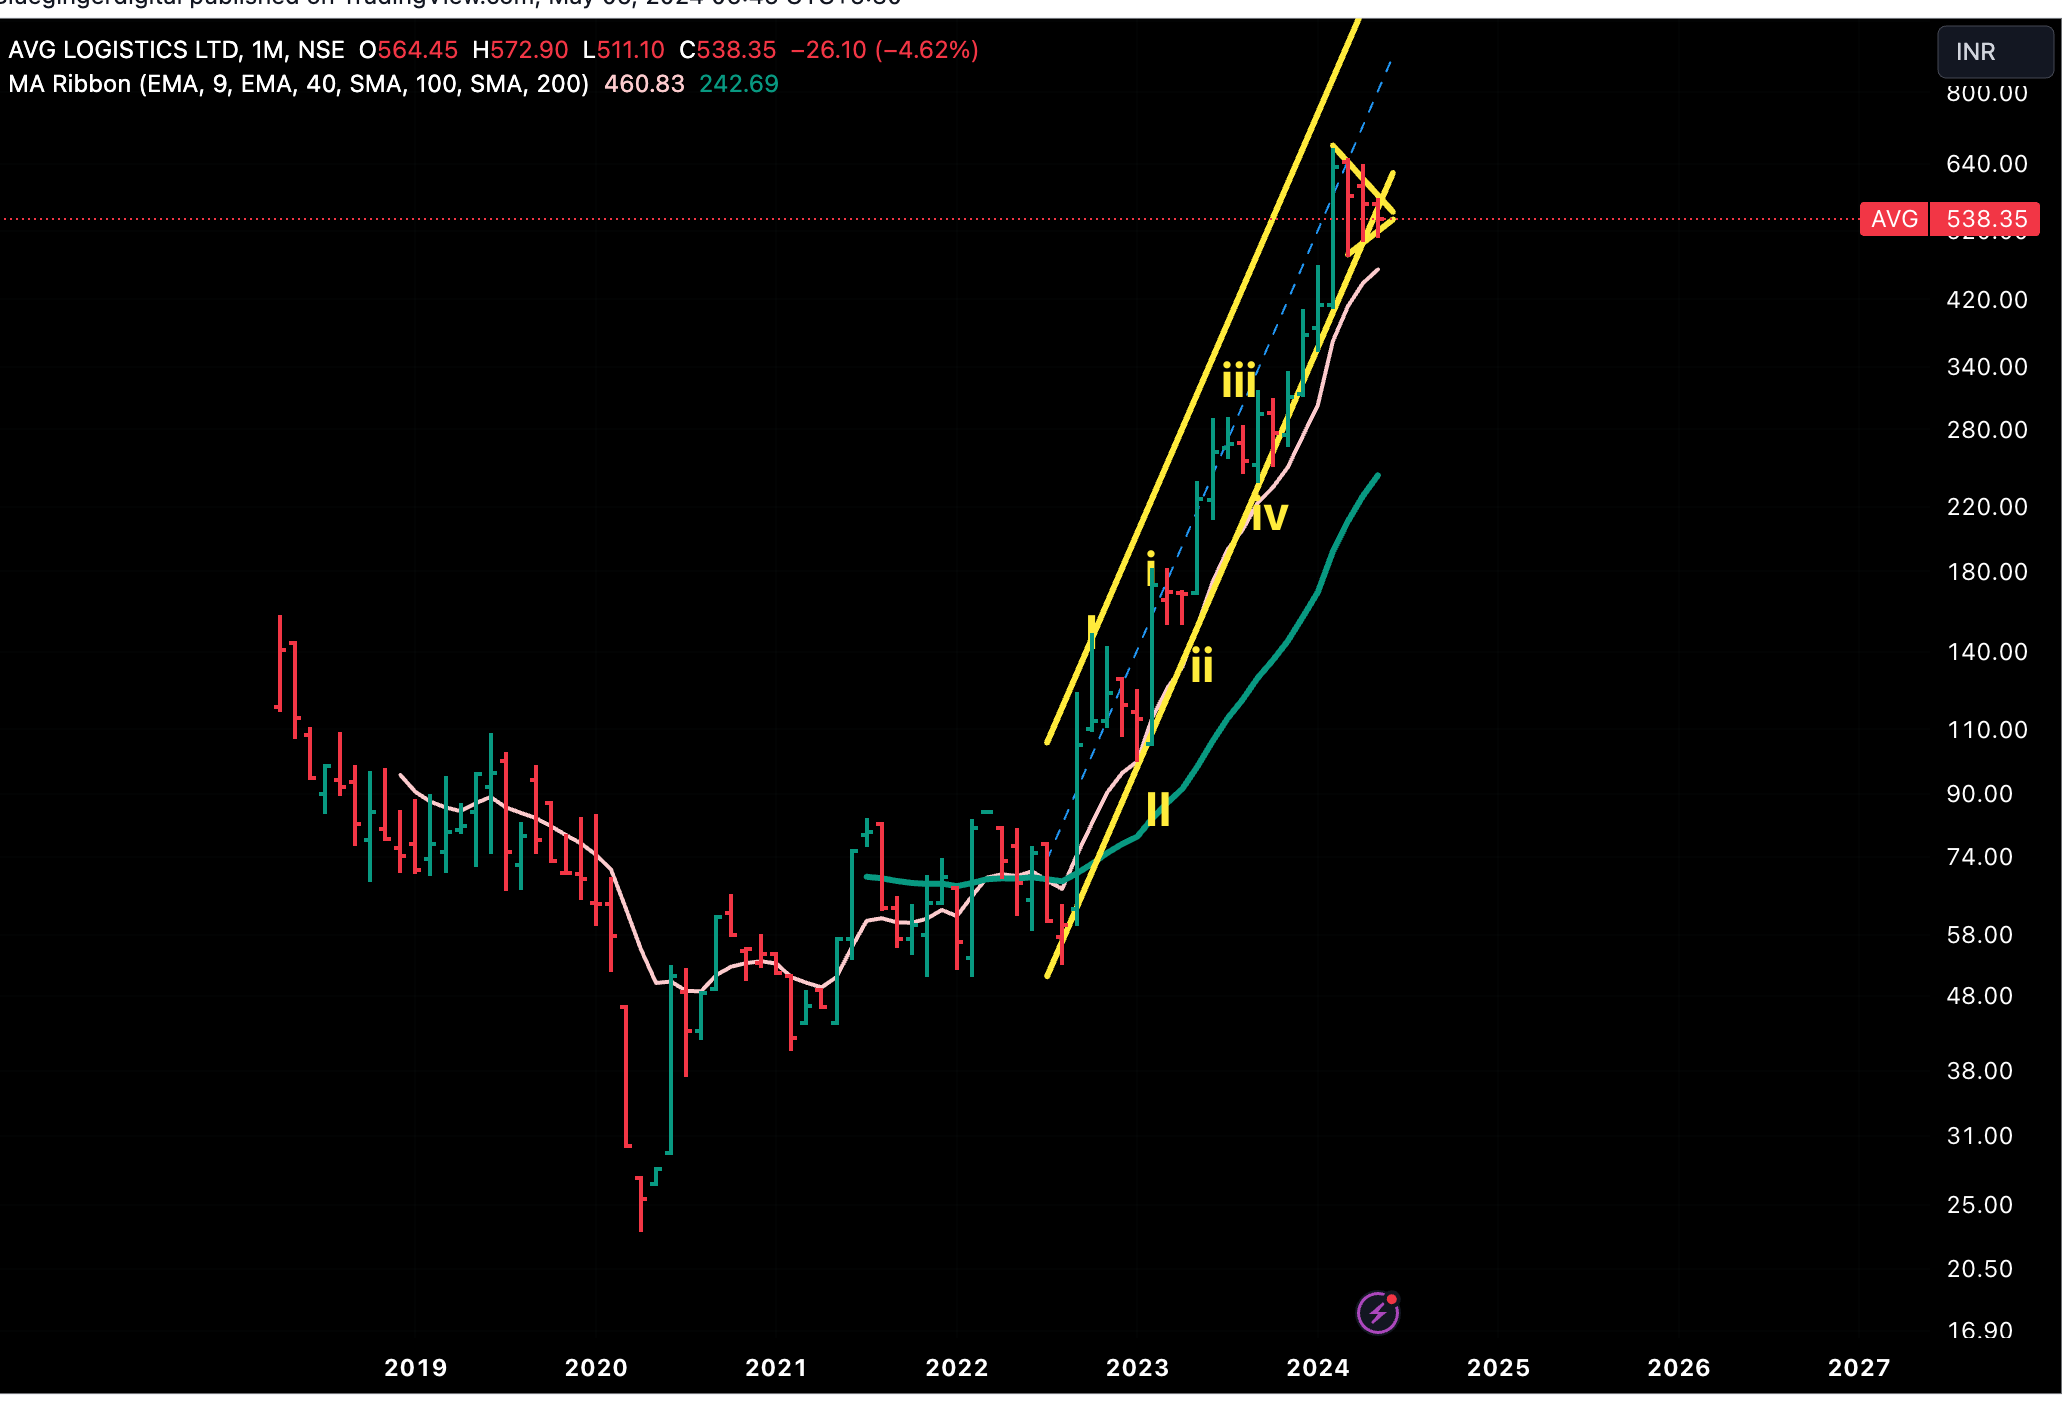
The chart does not give so much confidence. We can expect maximum one leg as upside but don’t see huge upside ( on technical analysis basis), It has also broken long term rising trendline (starting from Aug 22)
The stock has become more than 7 X in last one and half years( price was 82 in Sept 22.) and it has become 3 X in last one year ( price was 184 in May 23).
As per our observation ( 7 out of 10 times), stock price tend to take rest after such a run (profit booking, lack of new big -hands etc etc).
We might be proven wrong but we would wait for the last leg to play out ( small one ), or wait for some correction before entering the same.
Disclaimer: This is our view just on the basis of technical charts, no buy-sell recommendation.
| Subscribe To Our Free Newsletter |
