
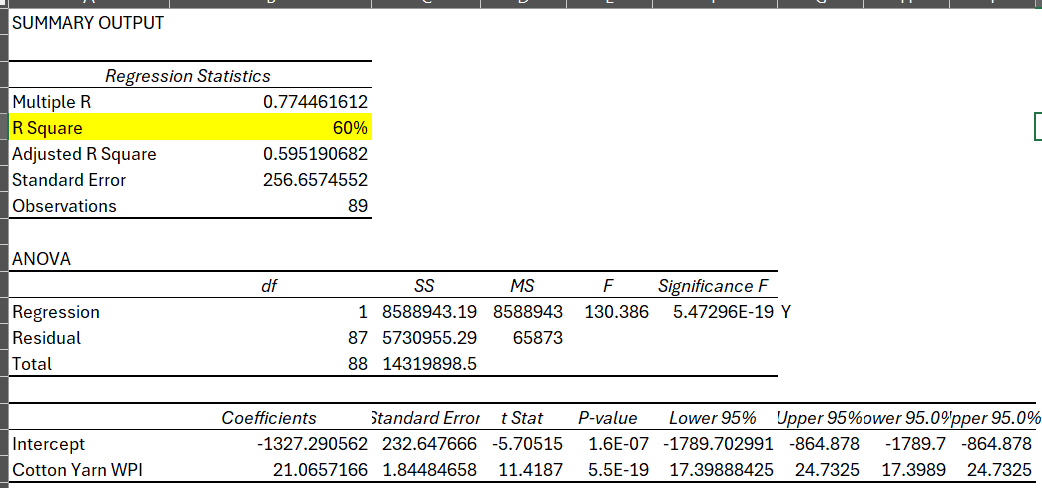
I did a linear regression of Cotton Yarn WPI monthly price data vis-a-vis monthly stock price of major listed cotton yarn players – It looks like Ambika’s stock price is the one that most closely follows the cotton yarn price
| Company | CMP correlation with Cotton Yarn Price |
|---|---|
| AMBIKA | 60% |
| VART | 49% |
| Rajapalayam | 1% |
| NITIN | 47% |
Now that we’ve established that cotton yarn price increase will also lead to increase in Ambika’s stock price, how do we establish that cotton yarn prices are rebounding back to previous peak?
I looked at the WPI data and it looks like 2022 was a major exception in terms of cotton yarn price increase. No other year has the cotton yarn prices have increased so much.
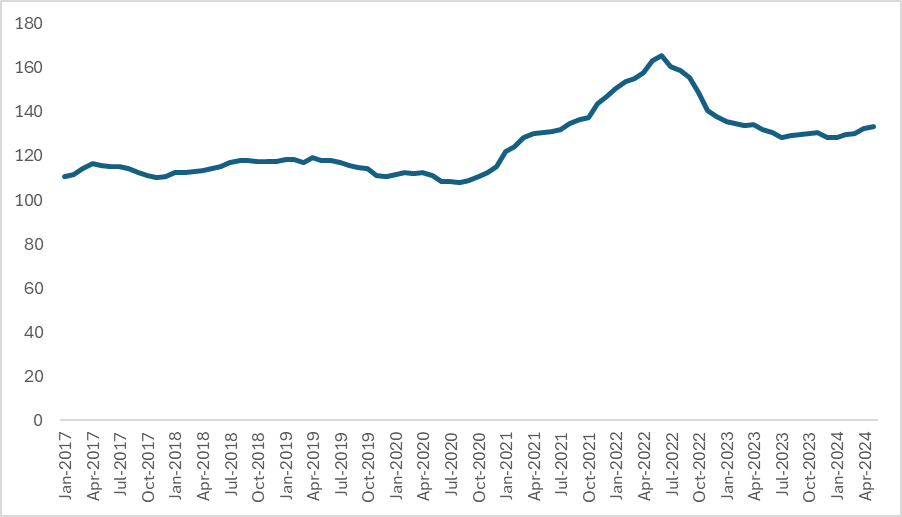
Honestly, cotton yarn prices had remained static for 8 years prior to 2020 irrespective of inflation.
| Calendar Year | Index |
|---|---|
| 2023 | 131.4 |
| 2022 | 154 |
| 2021 | 133.2 |
| 2020 | 111 |
| 2019 | 116.1 |
| 2018 | 115.5 |
| 2017 | 113.2 |
| 2016 | 108.4 |
| 2015 | 107.7 |
| 2014 | 117.5 |
| 2013 | 113.7 |
If anyone with experience in this sector could chime in? @sunilkumarca3101
| Subscribe To Our Free Newsletter |
