
         Are you an Investor into Indian Equity market. Do you know how to measure your portfolio risk. I will give tabulated data for large cap at the end of this write-up, you can use it as a ready reckoner-You can safeguard your interest by diversifying and distributing your holding value as per Markowitz model-which I will discuss sometime later.

       Assume you are investing into large cap there are 284 listed large cap in NSE. If you look at historical data in last 10 years 10% of them have failed or its prices have crashed below 95% of its peak value.  That is approximately 28 scrips out of 284.  It means you can expect 28 black-sheep in 284 large cap, mid cap it is 30% and small cap it is 40%.
There is a distribution called hyper geometric distribution. We will go to game of cards, if a deck of 52 cards in distributed to 4 players , what is the probablity that you have ( as one player) has exactly one J, 2 J’s, 3 J’s and 4 J’s . This is hypergeometric distribution where I assume J as black sheep and total number of scrips you have is 13 out of total 52 scrips available.
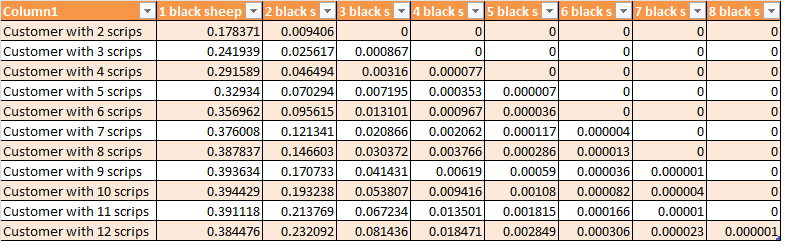
Here is the computed probability table for large cap below, first row has two scrip, second one has 3 scrips—and first column is probability that exactly one of them is black sheep, column 2 is exactly 2 of them is black sheep. If you need to diversify you can think column where probability is less that 0.05 (5 %) right of which is what will survive. Worst scenario is left of these columns are the scrips you have invested most! This is the worst outcome you can expect-
Here is the table:
| Subscribe To Our Free Newsletter |
