
It will support domestic refiners and encourage value-addition, says outgoing chief Jhunjhunwala
NowPurchase secures funding of $6 million (19-09-2024)
The majority of the funds were raised through equity, with Info Edge Ventures leading the round,
Technical Breakout Stocks: Info Edge, PB Fintech and Bharti Airtel hit fresh record highs; what should investors do? (19-09-2024)
Info Edge, PB Fintech, and Bharti Airtel reached new record highs on Thursday, with Info Edge gaining over 1% and PB Fintech surging more than 4%. Bharti Airtel, however, retreated slightly after initially hitting a fresh peak.
“Kothari Petrochemicals: From Poly to Power – Shaping Tomorrow’s Petrochemical Landscape” (19-09-2024)
Some of this is based on work of Jim Simons ( Renaissance Technologies ).
I leave up to other experienced members of this forum to try to look into this, and provide more insights. If any one know any one with expertise in this, then please tag them here.
Thanks
Fed rate cut impact: Govt bond yields at lowest since Feb 2022, rupee at two-month high (19-09-2024)
Sovereign bond yields hit a two-and-a-half-year low on Thursday, and the rupee strengthened to a two-month high. The Fed’s rate cut and positive commentary boosted emerging market assets, leading to a decline in government bond yields.
“Kothari Petrochemicals: From Poly to Power – Shaping Tomorrow’s Petrochemical Landscape” (19-09-2024)
Sharing a Hypothesis:
1. Lag correlation model:
A lag correlation model between Brent Crude prices and Kothari’s stock could indicate that a 5% increase in crude oil prices leads to a 2-3% decline in Kothari’s stock price after a lag of, say, 15 trading days. This would help set up hedging strategies and time entry/exit points into the stock.
2. Factor-Based Regression Analysis
Stock Return=α+β1(Brent Crude)+β2(INR/USD Exchange Rate)+β3(Global PIB Demand)+ϵ
Where:
- β1 represents the sensitivity of Kothari’s returns to oil price fluctuations.
- β2 represents the impact of currency fluctuations, specifically the Rupee/Dollar exchange rate.
- β3 measures how much Kothari’s returns correlate with the overall global PIB demand.
3. Pattern Recognition and Machine Learning
Eg. The model could detect that a combination of falling oil prices and a weaker Rupee has historically been associated with positive price movements in Kothari Petrochemicals within the following 30 days. This insight could then inform a buy recommendation when these conditions are met in real-time.
4. Risk and Volatility Analysis
Calculating historical volatility using metrics like:
- Standard deviation of price movements.
- Value-at-Risk (VaR) to estimate the potential loss on any given trading day.
- Expected shortfall to capture extreme risk events in volatile environments.
Example Calculation**: If Kothari’s historical volatility is 20%, and we estimate that a 1 standard deviation move (based on recent oil price spikes) could result in a 5% stock price drop, the model would reduce exposure in times of heightened market stress.
5. Statistical Arbitrage and Correlation Analysis
Analyze minute-by-minute price movements of Kothari relative to peers like ExxonMobil and BASF (other large PIB producers) to identify statistical arbitrage opportunities
6. Multi-Factor Regression Analysis
The dependent variable (Y) would be the stock return for Kothari Petrochemicals (percentage change in stock price), and the independent variables (X) would include:
- x1 : Brent crude oil prices (as a proxy for input cost fluctuations)
- x2 : INR/USD exchange rate (affecting export profitability)
- x3 : Global PIB demand (affecting revenue from international markets)
- x4 : Time lags (for predicting delayed reactions to economic changes)
The multi-factor regression equation would look like this:
Y= α + β1X1 + β2X2 + β3X3 + ϵ
Where:
- Y = Kothari stock return
- X1 = Brent crude price (in USD)
- X2 = INR/USD exchange rate
- X3 = Global PIB demand
- ϵ = Error term
- β1,β2,β3 = Coefficients to be estimated
Step 1: Stock Price Return Calculation
![]()
For this example, let’s assume that we have weekly price data for Kothari for June 2024, which ranges between ₹135 to ₹142 over the four weeks:
- Week 1: ₹135
- Week 2: ₹138
- Week 3: ₹140
- Week 4: ₹142
The weekly returns would be calculated as:
Week 1 to Week 2: 2.22%
Week 2 to Week 3: 1.45%
Week 3 to Week 4: 1.42%
Step 2: Factor Data
We now run the regression using the historical price data and the independent factors (Brent crude and exchange rates) to estimate the coefficients ( β1,β2,β3 )
Assume after running the regression, the results yield the following:
Y = 0.015 + 0.35X1 − 0.40X2 + 0.10X3Y
So,
- A 1% increase in Brent crude prices leads to a 0.35% increase in Kothari’s stock returns.
- A 1% strengthening of the INR (appreciation) leads to a 0.40% decrease in Kothari’s stock returns (negative impact on exports).
- Global PIB demand has a smaller impact, but a 1% rise in global demand increases Kothari’s returns by 0.10%.
Using this regression model, we can now input future estimates of Brent crude prices and INR/USD exchange rates to predict Kothari’s future returns. For instance, if Brent crude is expected to rise by 5%, and the Rupee is projected to strengthen by 2%, we predict:
We can also try
Volatility and Value-at-Risk (VaR) Calculation
Calculate VaR to understand the downside risk Kothari might face over a given period based on its historical volatility.
Assume Kothari’s stock has a standard deviation (σ) of 2.5% over the past 90 trading days (which could be calculated from daily returns).
We calculate VaR at the 95% confidence level for one day:
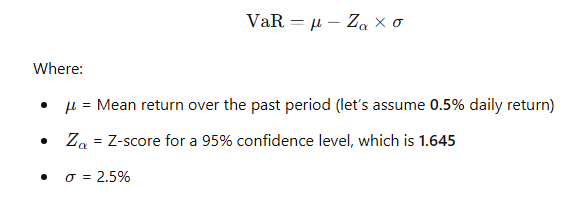
This means there is a 5% probability that Kothari’s stock could drop more than 3.61% in a single trading day.
If Kothari’s stock is currently trading at ₹142, a 3.61% decline would result in a potential drop of:
142 × 0.0361 = ₹5.13
Thus, Kothari’s stock could fall to ₹136.87 under this scenario.
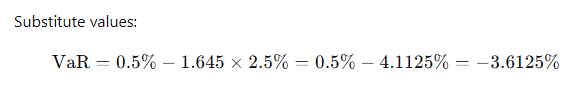
Another model we can try,
ARIMA (AutoRegressive Integrated Moving Average) model:
Another method,
Predicting Margins Using Oil Price Sensitivity
Kothari Petrochemicals is sensitive to oil price movements due to its reliance on isobutylene, which is derived from crude oil. Let’s calculate sensitivity between oil prices and gross margins.
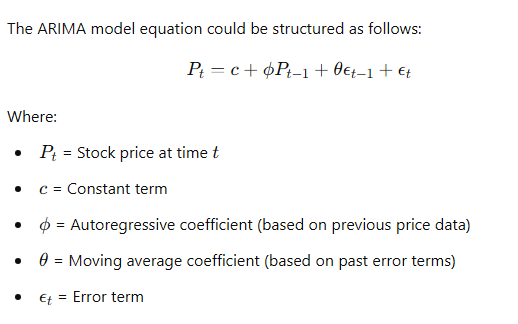
Assume Kothari’s gross margin is 28.4% (as per June 2024 data). If oil prices rise from $85 to $95 per barrel, we expect input costs to increase, reducing Kothari’s gross margin. By applying a cost-sensitivity ratio, we can predict the impact on margins.
- Historical Sensitivity: Let’s assume, based on historical data, that for every $10 increase in oil prices, Kothari’s gross margin decreases by 1.8%.
If Brent crude rises to $95 per barrel:
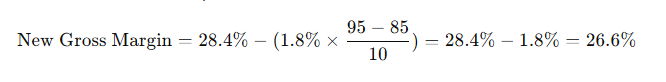
Thus, if oil prices rise to $95, Kothari’s gross margin could shrink to 26.6%. By simulating oil price changes over time using Monte Carlo simulations, we can develop probabilistic forecasts for Kothari’s margins.
Tech View: Nifty forms shooting star candle, consolidation likely to continue. How to trade on Friday (19-09-2024)
A small negative candle with a long upper shadow on the daily chart suggests a false breakout above 25,500. This sharp rejection from new highs indicates a potential short-term dip, according to Nagaraj Shetti of HDFC Securities.