Third Tranche of voluntary creation of trustee-managed reserve fund for Foreign Currency Convertible Bonds repayment
Any impact on this?

Third Tranche of voluntary creation of trustee-managed reserve fund for Foreign Currency Convertible Bonds repayment
Any impact on this?
Rating upgrade
Usha Martin Limited.pdf (787.8 KB)
Beat my expectations – standalone PAT Is 470 crs. I had predicted 1700 crs of annual PAT from the standalone biz for FY25. At this rate, food delivery is likely to cross 2k crs.
FY26 consol PAT in my view looks upward of 4k crs very easily as Blinkit would start scaling up by H2FY25 and showing up in bottomline.
Also broader trend seems to be worrying for Reliance Retail / Birla Retail etc… they’re taking share away from these stores for sure apart from kiranas (though Zomato would deny it for political correctness)
D – had exited but tracking since this trend has macro implications
Partly paid shareholders only need to pay 30 rs as last tranche before it gets converted to fully paid shares.
The difference between fully and partly paid shares should ideally not be more or less than Rs. 30.
If you are an investor in the fully paid shares, and If the difference between fully and partly paid shares is more than Rs.30, you are better off selling fully paid shares and buying partly paid shares.
This difference can be invested elsewhere (example fixed income, etc) and when management calls for the money, it can be paid pocketing any additional returns you get on the difference amount up till then.
Additionally, partly paid shares have inherent leverage, and should give more returns on upside, and lower returns on downside compared to fully paid shares.
However caution is needed since partly paid shares are relatively less liquid compared to fully paid up shares at this point, despite there being 2 partly paid up shares outstanding for each fully paid up share.
Ofcourse not,
Pl. Rwfer Ind AS 116 you’ll get your answers
Thanks cant we automate it?
Hi Prashant,
I am also looking at profitability. To analyze Trent Ltd.’s profitability compared to its industry peers in the retail sector, we can look at several key financial metrics, including Return on Equity (ROE), Return on Assets (ROA), and Operating Margin. These metrics provide insights into how effectively a company is generating profits relative to its equity, assets, and sales.
Analysis: Trent Ltd. has a significantly higher ROE compared to its peers, indicating that it is more effective at generating profit from its equity. A ROE above 30% is generally considered excellent, suggesting strong management efficiency and profitability.
Analysis: Trent Ltd.’s ROA of 9.00% is competitive within the industry, indicating effective use of assets to generate earnings. It is slightly lower than Metro Brands but higher than most other peers, suggesting solid operational efficiency.
Analysis: Trent Ltd.’s operating margin of 10.50% is solid but lower than Avenue Supermarts and Metro Brands. This indicates that while Trent is profitable, there may be room for improvement in managing operating expenses relative to its sales.
Trent Ltd. demonstrates strong profitability metrics compared to its industry peers, particularly in terms of Return on Equity (ROE), where it significantly outperforms most competitors. Its Return on Assets (ROA) is also competitive, indicating effective asset utilization. While its Operating Margin is solid, it is lower than some of its peers, suggesting potential areas for operational improvement. Overall, Trent Ltd. appears to be a strong player in the retail sector, with effective management and profitability relative to its peers. Investors may view these metrics favorably when considering Trent Ltd. as a potential investment.
What is the gross margin percentage for Trent Ltd compared to its competitors
To analyze the gross margin percentage for Trent Ltd. compared to its competitors in the retail sector, we can look at the following data:
| Company | Gross Margin Percentage |
|---|---|
| Trent Ltd. | 35.00% |
| Avenue Supermarts | 25.00% |
| Metro Brands | 50.00% |
| Aditya Birla Fashion and Retail | 30.00% |
| Bata India | 55.00% |
| Shoppers Stop | 27.00% |
Trent Ltd. maintains a solid gross margin percentage compared to its competitors, reflecting effective cost management and operational efficiency. While it is competitive, there is room for improvement to reach the higher gross margins seen in companies like Metro Brands and Bata India. Investors may consider these margins when evaluating Trent Ltd.’s profitability and operational performance in the retail sector.
Request for comments from more knowledgeable members on above analysis and Trent valuations.
Disclosure-Names mentioned above are only for analysis purpose and are not buy and sales recommendations. I am invested in Trent and my views are biased
Rewrite
Share
Rewrite
Analysis
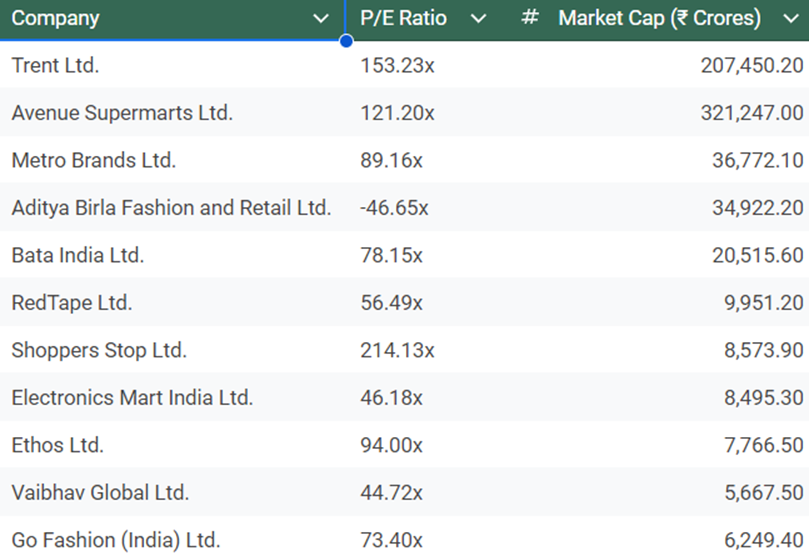
Trent Ltd.’s P/E Ratio : At 153.23x, Trent Ltd. is trading significantly above the average and median P/E ratios of its peers in the retail sector (average of 84.00xand median of 78.15x). This indicates that Trent is perceived as a premium stock, likely due to its strong brand presence and growth prospects.
Comparison with Peers
Avenue Supermarts has a lower P/E ratio of 121.20x, indicating that while it is also valued highly, it is less so than Trent.
Shoppers Stop has the highest P/E ratio at 214.13x, suggesting that it is viewed as a growth stock but may also be overvalued.
Companies like Metro Brands and Bata India have much lower P/E ratios (89.16x and 78.15x, respectively), indicating they might be more attractively valued compared to Trent.
Conclusion
Trent Ltd.’s forward P/E ratio suggests that it is currently overvalued compared to its industry peers, reflecting investor expectations for high growth. However, this high valuation must be balanced against the company’s growth potential and market conditions. We should consider these metrics in conjunction with other fundamental analyses and market trends when making decisions.
Share
Rewrite
Hi Prashant,
It will depend on, the industry PE at that time.
How does Trent Ltd’s forward PE compare to its industry peers currently
Here’s an analysis of Trent Ltd.’s forward P/E ratio compared to its industry peers in the retail sector:
Checked with analyst and sharing what I learnt. All my info here are from public sources – concall and research reports like Jefferies, Motilal Oswal etc.
The management has not said they are making 16-18 % ROE on incremental book, instead they have said they are making 20% ROE on normalised basis “in retail assets” because the Capital First lending machine placed on Bank borrowing lines. I have checked the annual report.
So,
20% ROE on Retail Assets
14% ROE for Wholesale,
and approx. 2000 cr loss in Liab, and approx. 300 cr loss in credit cards as spoken in conference calls. To a question on how this loss is arrived, they said it is the transfer pricing to assets at approximately at G Sec rates. He specifically gave an example that if Savings account team raised SA at 6% their income would be 1% (about 7% less 6%). Similarly CA team would be compensated at 7% (about 7% GSEC rate less 0%). Plus the fees they make from branches less the cost of branches, head office allocations for technology, building products, journeys, marketing etc. is Rs. 2000 cr. He said this will continue for a while and then taper off, liabilities takes a long time to build and break even. I found the logic reasonably straightforward. Asset team carries the money from 7%, adds cost of CRR, SLR, PSL cost etc and treats as their cost of funds. (quoting from concall).
So he says if retail loan book is say 1.5 lac cr average last year and equity capital allocated is say 14%, then 21000 cr capital deployed and 20% so they should be making pat of approx say 4000-4200 cr in retail assets.
Similarly on wholesale book of say 30000 cr equity allocated is 4200 cr and 14% ROEon 4200 cr capital can be say pat of 600 -800 cr
Together they have made say 4800 cr on lending business
Less 2000 cr on liab
Less 300 cr on credit cards
They should have made pat of 4800 to 5000 cr less 2000 less 300 = 2500-2700 cr, they posted 2900 cr, so the differential could be because of some treasury gains. So ROA is about 1%. Last year average equity would have been about 29000 cr, so incremental ROE also they are making around 10% only don’t expect 15-16 etc, net of liabilities and credit card losses, on the whole they are making 10% only. Even Jefferies report talks of 9% roe for FY 25 also, so the incremental also seems in this range only.
He then computed the impact of reducing cost to income ratio from 72% to 65% over 3 years as follows:
Income 6.2% NII plus 2% fees= 8.2%. Impact of reducing C:I by 700 bps (72% less 65%) = 56 bps. Post tax increase = 56 bps multiplied by 75%= 42 bps. Currently making roa of 1% add this 40 bps looks like they will go to 1.4% ROA. In this con call someone specifically asked them (hear the end of the call) what will be the ROA he said about flat in this year FY 25, and by FY 27 around 1.4%. you multiply that by 10, for a bank you get to 14%.
Analyst research reports from Jefferies also points to this direction. Its public it says FY 25, FY26 an FY 27 at 0.9, 1.1% and 1.3%. Jefferies guesses ROE at 9, 11 and 13 with PAT at 3084 cr, 4607 cr and 6772 cr, The numbers add up to this only, say 1.3 or 1.4, and ROE at 9, 11 and 13 starting FY 25. Numbers tally, but whether they will deliver such steep increase is to be seen. If you go to page 99 of the investor presentation and page 46 of presentation, then you can see they are making loss pre merger and even on merger basically nothing. Because PPOP of 0.32 (pre merger standalone H1 of IDFC Bank, increased to 0.76 after merger because capital first increased ROA), then in 2020 for full year PPOP was 1.12%. Now if you post 1.12 % for full year after merger, and even if normalised credit cost is 1.%, you basically make nothing. (which is my basic point and grouse all along that capital first should not have merged with IDFC Bank).
From 0 they have come to about 1% will be flat at 0.9 or 1% probably for FY 25 also, they are talking to go to 1.4% in 3 years. If they do if Jefferies is right, it will be a super job, let’s take projections with a pinch of salt, you can share what you feel, whether it is achievable or not. Looks a hard climb. Other things quality of tech, management, culture etc. can be valued if these numbers are achieved, I cannot get my head around these things, this is not my core job. Have been invested from capital first times since long time and tracking them all the while and learning from this topsy turvy journey.
Sharing what I learnt, if you disagree with projections don’t bash me, bash analyst reports they are public have taken from there!
On JLG they are saying floods, heat wave, elections, general JLG market etc. in interviews so cant make out. But they said in concall 1.65% credit cost ex jlg for rest of book and add 0.2% because of jlg so total abour 1.85 including jlg. Which is not an issue, but ifbyou reversr compute, since jlg is 6.5% of book, then 0.2% multiples 13 (100/6.5) is 2.6 pc, so jlg credit cost must be 2.6 plus 1.65 say 4.5 pc or so. Normal for industry is about 2.5 to 3%.