At the end of FY25 or FY24?
I also read in their May Presentation that they have debt of 175cr,i think screener data is not updated yet

At the end of FY25 or FY24?
I also read in their May Presentation that they have debt of 175cr,i think screener data is not updated yet
Hello All,
As per the presentation, Iris business services being a small company dealing with multi national stock exchanges, banks & financial institutions.
I would like to stay away until the company reports continuous positive operating cash flows & healthy working capital cycle.
Hi …
I am reasonably sure that the total debt figure for the company ( Kamat Hotels ) at the end of FY 25 is around that 175 cr mark
Can’t comment on the screener’s data ![]()
Kajaria Ceramics –
Q4 FY 24 concall and results highlights –
Revenues – 1241 vs 1205 cr
EBITDA – 171 vs 176 cr ( margins @ 14 vs 15 pc )
PAT – 104 vs 111 cr
Tiles sold @ 29.57 vs 28.02 MSM ( up 6 pc YoY )
Q4 Revenue breakup –
Tiles – Own manufacturing – 606 vs 599 cr
Tiles – Subsidiaries – 225 vs 231 cr
Outsourced – 259 vs 253 cr
Sanitaryware – 32 vs 18 cr
Plywood – 102 vs 90 cr
Adhesives – 14 vs 11 cr
Manufacturing capacities –
Ceramic wall and floor tiles – 36 MSM
Polished vitrified tiles – 15.4 MSM
Glazed vitrified tiles – 35 MSM
New plant in Nepal ( capacity @ 5.1 MSM ) expected to go live by Jul 24
Company has acquired a Tiles plant in Morbi
( Gujarat ) for 65 cr. It has a production capacity of 6 MSM
Commenced commercial production of sanitary ware from a new facility at Morbi ( current capacity at 4.5 lakh pieces / yr )
Going to spend Rs 15 cr to set up a manufacturing facility for adhesives in Gailpur in Rajasthan
Next 3 yrs guidance ( on a conservative basis ) –
Consol revenues > 6500 cr ( 5500 cr from tiles, rest from others )
Tiles manufacturing capacity @ 150 MSM
EBITDA is the band of 15-17 pc
Aggressively focussing on opening new exclusive branded stores in Tier -1,2,3 towns
To improve distribution to 2000 towns from 1000 towns at present
Generally see strong demand in a RE upcycle wef T+2. Current upcycle started in 2022. Expecting strong demand wef Jun this year
Expecting double digit volume growth in FY 25 ( 11-13 kind of band )
Gas prices continue to remain stable
Institutional : Retail sales mix @ 30:70 vs industry norm of 50:50. That’s why their margins are better
Break up of 30 pc of institutional sales – Govt projects : large builders : mid and small size builders @ 12 : 08 : 10
Institutional sales margins are 4-5 pc lower than retail sales margins
Disc : holding both Somany, Kajaria ceramics, not SEBI registered, biased
Is there any value creation in their demerger? if any one is tracking, please share your view on it
Screener is not showing the right debt and P/E ratio or am i missing something?
Debt- 175cr(Screener- 265)
P/E- 260/18=14(Screener P/E- 31)
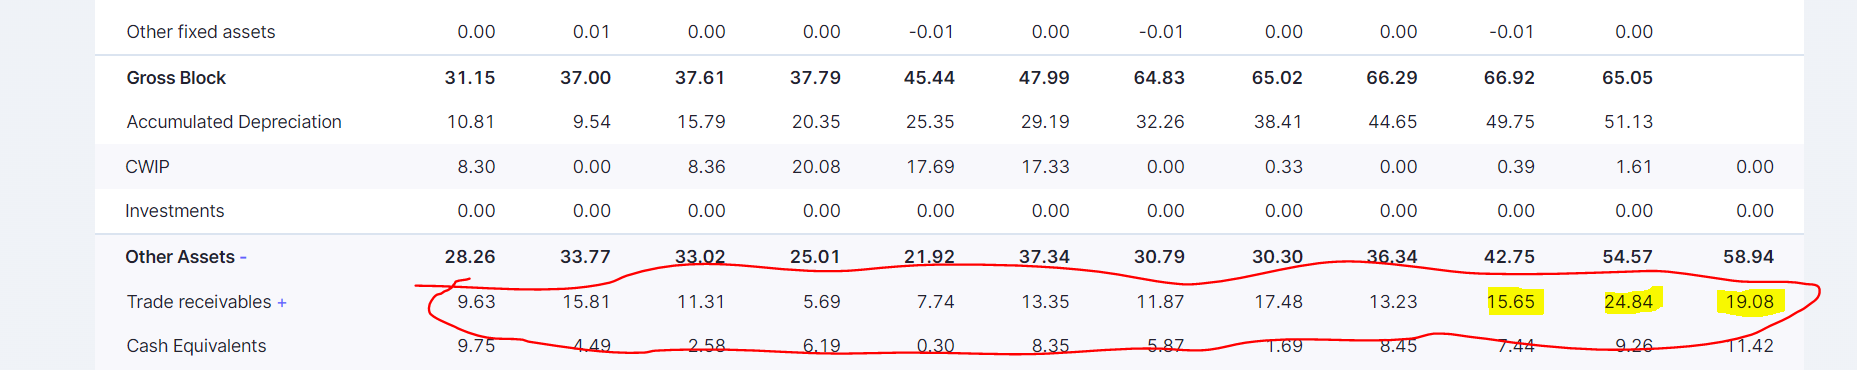
My notes based on FY24 results:
Also, I am not sure what they will do with 600 Cr cash holding in their balance sheet since ages, without any need of capital in the business (Off topic but same thing applies in asset management companies (UTI AMC, HDFC AMC) which holds ton of cash without any need in the business).
This experience taught me that cash cannot be valued at face value in any business. I know it in theory, but knowing is not doing as experience is the best teacher.
Dsiclosure – Invested.
It may not be only Wine Tourism is the driver for seasonality. Tourism reported revenues actually are largest in the Mar quarter. There is a seasonality in the wine business – primarily due higher consumption during ‘festival’ season. See revenues by quarter (INR mn) and segment for the last two financial years. The Mar quarter is the largest quarter for wine tourism
| Segment revenues | Q1 FY23 | Q2 FY23 | Q3 FY23 | Q4 FY23 | Q1 FY24 | Q2 FY24 | Q3 FY24 | Q4 FY24 |
|---|---|---|---|---|---|---|---|---|
| Own brands | 783 | 1,133 | 1,856 | 1,035 | 1,017 | 1,268 | 1,928 | 1,129 |
| Wine Tourism | 103 | 96 | 124 | 127 | 115 | 121 | 147 | 164 |
| Others | 86 | 48 | 103 | 38 | 34 | 39 | 100 | 24 |
However, please note that the wine tourism reported revenues are primarily revenues for hospitality. There is also an element of wine sales (e.g. through their shops) that are captured as part of wine sales (rather than tourism sales). In the call yesterday they indicated this number is ~15% of wine sales.
Growth prospects data center industry in India
Data center industry is promising based on following several key factors:
1. Demand Outlook:
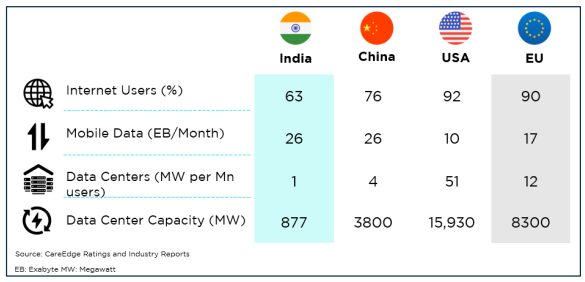
Digital Transformation: India’s transition to a developed market economy is driven by digital transformation, accelerating economic growth and big data production. Due to Continuous expansion of e-commerce, fintech platforms, gaming & online streaming services will increase internet penetration, which is expected to reach 87% in FY29. The introduction of tech such as 5G, IoT and AI is expected to increase significantly and the demand for data will accelerate the growth of data centers industry.
Internet Penetration as on FY23:
2. Lower Per MW Costs:
In India there is cost advantages for setting up of data centers because of relatively lower land and labor costs. The capex required to set up a data center in India is about 45% lower than the global average.
3. Government Incentives and Regulatory Measures:
Central and State Governments provide incentives such as infrastructure space, credit lines, power subsidies and regulatory support for data localization. Actions such as Draft Data Center Policy 2020 and Infrastructure focus in the Union Budget 2022-2023 will encourage investments and economic growth.
4. Growth potential and proposed investments:
Data center capacity in India is expected to double to around 2000 MW by 2026, requiring an investment of Rs. 50,000 crores over the next three years. The capacity of the industry has increased rapidly and it was predicted to reach almost 900 MW by 2023, and the growth rate is about 100-150 MW per year.
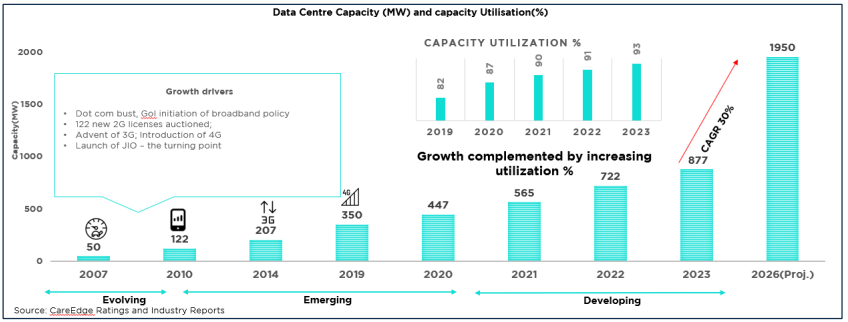
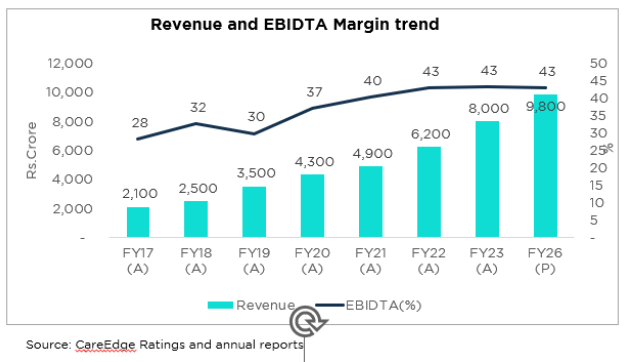
Revenue growth of data center operator was approximately 24% CAGR from FY17 to FY23. Now, it is expected to continue at a CAGR of 32% from 2024-2026. EBITDA margins was stable at around 43% in FY 2022-23, and they should remain stable for the next 2-3 years as well.
Key Capex Metrics:
1. Land & construction:
About 40% allocation of the capex is required for land acquisition and building construction, including fit-outs.
2. Power system:
Another 40% of investment is required to be allocated to the power system, including power infrastructure, distribution systems and backup energy sources such as generators and UPS systems (uninterruptible power supply).
3. Heating, Ventilation and Cooling (HVAC):
The remaining 20% of the cost is spent on the heating, ventilation and cooling system, which is critical to maintaining the optimal operating temperature of the data center. In addition, the cost of setting up a data center will also be affected by regulations regarding scalability, design and location.
Key operating cost metrics:
Energy consumption: represents approximately 65% of total operating costs, including electricity used in IT equipment and cooling systems.
Cooling system costs: necessary to maintain the optimal operating temperature of the data center.
IT equipment maintenance costs: includes maintenance and service costs for servers, network equipment and storage systems.
Personnel Costs: The cost of hiring and maintaining personnel, including network engineers, system administrators, and security personnel.
Security and compliance costs: includes implementing and maintaining security measures and ensuring regulatory compliance.
Property and Facility Maintenance Costs: Includes renting or owning a facility, maintenance and repairs.
Network Connection Costs: The cost of network connection services for data center operations.
Insurance and Taxes: Equipment and equipment insurance costs and property taxes.
Environment and Sustainability Initiatives: Investments in green technologies and sustainability to reduce environmental impact, including renewable energy sources and energy-efficient appliances…
Reference:
Dhabriya gives end to end solutions (installation etc) so margin profile is higher than Kaka, my analyst has visited both plants and preferred Dhabriya over Kaka Ind. Plus the modular segment of Dhabriya is very interesting