
No promoter buying here. Shares got transferred from Late Mr M.S.Jolly to his son Mr Karan Jolly.
Posts tagged Value Pickr
The harsh portfolio! (25-04-2024)
I think HDFC AMC AUM growth will not be in commensurate with its Operating revenue growth percentage.
For example, looked at YoY growth % of HDFC AMC w.r.t FY23 end → FY24 end,
AUM increased by 40% but Revenue increased by only 20%
Feel in case of CAMS, as it’s in services business, whatever CAGR growth mentioned (11%) will reflect in operating revenue.
So, not sure comparing HDFC AMC AUM growth % with CAMS CAGR growth % are the right metrics to compare for valuation perspective. Just presenting my opinion and welcoming others thoughts.
Music Broadcast Limited (Radio City) (25-04-2024)
e4e26b26-3456-4d43-af0b-daac837467c2.pdf (239.6 KB)
Music Broadcast Limited (Radio City) (25-04-2024)
e4e26b26-3456-4d43-af0b-daac837467c2.pdf (239.6 KB)
Excel Industries : Experience Certanity (25-04-2024)

It’s on the their website, the AR doesn’t mention how much % of sales is contributed by this product, would be interesting to know if any other makers as well. There is a mention of Phosphorus pentachloride in Guj Fluorochem’s concall as well.
52 week highs and all time highs strategy (25-04-2024)
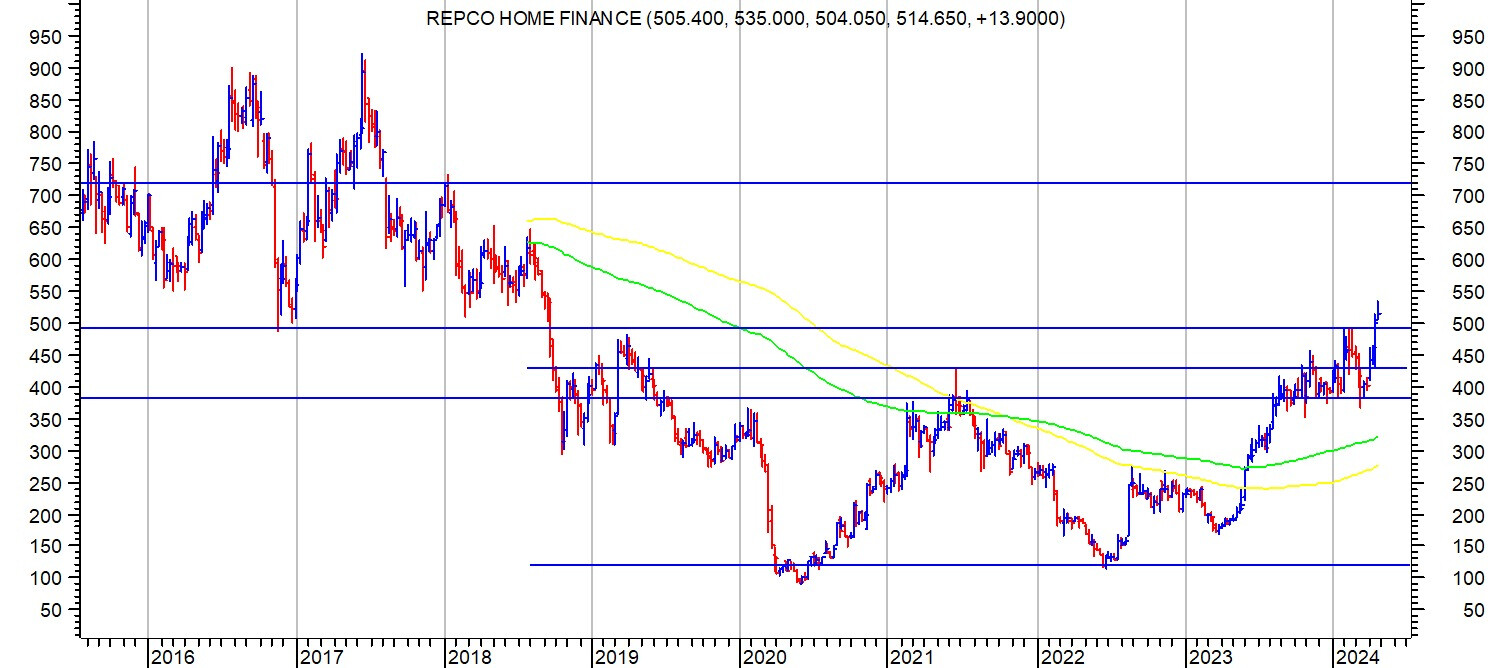
Repco cmp 516. Attached chart shows a W (double bottom formation) extending from 120 on lower end to 430 on higher side. Breakout on upper side happened in August 2023 and since then stock price was in consolidation phase. Recently it broke out above 500 and has been consolidating above that. Fundamentally company does concalls and presentations and one can study the details there. disc: invested as a techno funda bet.
One of the models I often use is multi year breakouts with cheap vauations post breakouts. On conventional parameters, Repco satisfies this criteria.
(This is not a recommendation. Anyone contemplating investment in this company should do their own diligence. )
Adwait’s Investment Approach and Journey (25-04-2024)
Hello everyone,
As clichéd as it may sound, I too have been a long time lurker in this community, which I have browsed in search of informed opinions with respect to my own stock picks, diverse investment philosophies, and approaches to investing in general. I would like to thank the many contributors to this forum which make it a goldmine of learning for newbie investors like myself. After dabbling in publicly listed equities for almost a decade, I think it’s time for me to share my own investment approach and receive feedback from the wider public.
Why do I invest in equities?
It is an asset class which is the least risky in the long term, because it enables real wealth creation through value addition to society and civilization. What helps additionally is that it also liquid, capital gains are conservatively taxed (till now), and there is no minimum ticket size required for me to participate. This makes it the best asset class for me in my unique life situation for wealth creation.
What is my investment philosophy?
I wish to be a permanent owner of a high quality business.
I believe that picking individual stocks and creating a portfolio is an exercise of stacking odds in your favour, so that a desirable outcome maybe achieved in due time (measured in decades).
Stock Screening Filters – (These filters ensure the long term survival and prosperity of minority shareholders is NOT in jeopardy)
- Clean Promoters and Management
- Avoiding Leverage
- Avoiding M&A Junkies
- Avoiding Turnaround Situations
- Avoiding unaligned owners (PSUs, Large Corporate Houses, MNCs with unlisted subsidiaries)
- Avoiding unpredictable, fast changing industries
The checklist has been borrowed from Pulak Prasad’s book. He has articulated the why’s far better than I can. But essentially, avoiding these risks reduces errors of commission at the expense of increasing errors of omission (which means we live to fight another day.)
Adding to pt 6. I also avoid all industries/sectors where the historical ROIC – WACC spread is insufficient. This indicates that industry dynamics are brutal, and do not allow even it’s dominant players to consistently earn a ROCE above the COC.
Therefore, I only stick to these sectors (where the long term ROIC – WACC spead is tilted in my favour) –
- Consumer Staples
- Consumer Discretionary
- Pharma, Healthcare, Diagnostics
- IT Services
Incidently, this idea is borrowed from Terry Smith. (All my ideas are borrowed from investors I admire.)
After I have filtered out the potential candidates for errors of commission (pt. 1 to 6), and candidates not belonging to the aforementioned sectors, I apply my next set of financial filters.
TRIGGER WARNING – I am an admirer of Saurabh Mukherjea and Marcellus Investment Managers (including their books and newsletters). Those who do not subscribe to his views will not agree with the following approach. So be it.
Financial Filters –
- ROCEs above 18% consistently for the past 10 – 15 years (with exceptions for COVID and other such calamities)
- Operating Revenue Growth of above 10% for the past 10 – 15 years
- FCF Growth – General Upward Trend
- Cash Reinvestment rates – (Increase in WC + Increase in CAPEX/CFO) between 50 – 80% – 3 or 5 year average annualized
After applying the following filters, I am left with very few businesses that would interest me. I now try to answer the whys?
- Why consistently high ROCEs?
- Why consistently high Revenue Growth?
- Profitablity, Leverage, Operating ratios – do they make sense wrt the industry and do they sync together?
- Risks to survival/existence 20 – 30 years from today
- Porters 5 forces model, Cost Leadership vs Product Differentiation, Big Fish in the value chain, Niches, Sir John Kay’s IBAS framework.
The next pertinent question that I ask myself is with respect to valuations – What is a price that I am willing to pay for them?
I anchor my price to the median TTM P/E of the market index, and do not pay for any multiple above that price. I will also look at the median TTM P/Es of the sectoral indexes to fine-tune this anchor. I might occasionally overspend a little bit for a franchise that I truly appreciate. But that is it when it comes to valuations.
I do not indulge in forecasting (DCF valuations) or any other excel wizardry for valuating a business.
Selling – I never sell a business until the business has obviously lost the plot (like DHFL or Vodafone India) or if the inital investing hypothesis does not hold true anymore (management makes a large unrelated acquisition, leverage, etc.).
I hope that I have been able to illustrate my investment philosophy adequately. I invite everyone to poke holes in it, or ask for further clarity on any of the topics.
I think there’s been more than enough gyaan in this next post. In the next post, I will try to argue the case for a particular stock that I own in my portfolio and do so for each stock in the weeks to come.
Happy Investing, and all the best.
Rajoo Engineers Ltd – Mfg of Plastic Extrusion Machinery (25-04-2024)
Interesting managment commentary
Rajoo Engineers Q4 Earnings Call Part1- Rajoo Engineers Q4 Concall
La Opala RG – Aspirational consumer story (25-04-2024)
Hi All,
Please find below analysis done on La Opala. Do let me know if I have missed on anything in this analysis
| Date of report: | 21-04-2024 | Competitor PE | 43.9 | Sector | Glassware |
|---|---|---|---|---|---|
| CMP: | 322 | Current PE | 26.8 | No of Years | 37 |
| Market Cap: | 3569 Cr | Highest PE | 71 | Key Products | Opalware Crockery |
| ROCE / ROE | 22.1% / 16% | Lowest PE | 8.4 | Key Competitor | Borosil, Cello, Unorganised Sector |
Background: A company in Tableware sector specializing in opalware crockery with 50% market share of organized sector and with upside potential of 2.1 times within 3 years. Today the company is cheaply valued as of current price and will be able to generate 2.1 times return in 3 years.
Business Model and Analysis
Overview:
Co produces opal glass tableware from entry level to premium catering to all type of customers. Co also produces items of Borosilicate to cater to “Cook Serve Store” Range
Industry Growth:
Industry for opalware is expected to grow around 6% CAGR till 2030. Growth in industry is primarily due to higher disposable income, increasing middle class base, increasing events and social parties and influence from social media to make home look more “aesthetic”
Capacity Utilisation:
The company has 2 plants one in Uttarakhand and one in Jharkhand. Plants are working at capacity.
Opportunities:
In opalware company operates at 3 price point under different brand to cater to entry level consumer to premium consumer. Co continuously innovates new designs to make its product in trend with market and create brand image. Co has a large market to penetrate as many consumers use unbranded tableware. Further imposing of anti-dumping duties by Indian govt over China and UAE market has made market penetration easier. Inflation for 24/25 is projected to be lower than 23/24 which will provide high disposable income in hands of consumer. The company has increased its number of distributors by 67% in last 3 years to avoid stock out situations. Co exports products in 30 countries which comprises of 10% of its Revenue. Exploring foreign markets will help in increasing topline and bottom line.
Risk:
The company has biggest threat from unorganised sector which operates at lower price point than the company. Entry level consumers are not concerned over brand and looks at price point while buying product. Creating a brand takes a long lead time and historical sales data proves that sales are flattish over 2-3 years period before they take a leap of 30%-40%. Raw Materials like soda ash, borax, sodium silico fluoride, quartz powder although sourced locally are heavily susceptible to price fluctuations.
Future Expansion:
Company is venturing into borosilicate market and plant will commence operation from FY25/26. This business will give direct competition to Borosils’ lunchbox and microwave ware segment. The management is predicting to generate its current OPM level ie 38% in this segment which is doubtful as Borosil generate around 8% in this segment. Due to its widespread distributor segment, co will gain advantage in entering this market
Competion:
- Entry Segment: Borosil is operating at lower price point and with similar ratings on Flipkart. Borosil has received more reviews than La Opala. Cello is also better than La Opala. La Opala is on verge of stock out sitaution in Online Market.
- Premium Segment: La Opala is able to beat its competotors in this segment with higher price point, better reviews and number of reviews. Products are on stock out situation
Further it is heavily vulnerable to competition from unorganised sector operating at low price points
Management:
The company is home run company run by its promoter, his son and daughter in law. Management is strong and has given sufficient information in it’s Annual returns. Further the management has not entered into any related party transaction. Promoters hold 65.64% share in company and has not pledged any share. Concerning points are that management takes around 12% of net profit as salary. Further there are no investor presentation or concalls available during the year by management.
Institutional Investor:
Institutinal investor are holding a steady 20% share in the company with HDFC (~6%) and DSP(~6%) being the constant shareholder*.*
Historical Data and Financials
Profit N Loss Account:
- Sales: Historical trends shows that co shows flattish sales growth for 2-3 years before taking a leap of 30-40%. This can be attributed to time taken for creating brand and penetrating the market. In 22/23 company showed a sales increase of around 40%. The sale has however declined in 23/24.
- Gross Profit: Co is operating at 38% Gross Margin. Borosil operates at 8% Profit Margin whereas Cello operates at 23%. High profit can be attributed due to its Premium product under brand name Diva and Solitaire Crystal
- Other Expenses: Salary cost has increased by 31% which is a sign that business is growing. Further the company has increased its marketing spend by 7x.
- PBT: Co operates at 37% PBT due to very low interest cost and depreciation. Further company gains from interest income and gain from investment to offset its other expenses cost.
- Net profit: Company operates at 27% Net profit.
Balance Sheet:
- Company is expanding its operation and has completed addition 11000mt pa capacity to its existing plants
- Debtor Days (29 days) has improved YoY.
- Inventory Turnover ratio stands 2.19 times and Working Capital Days are at 44 days
- Company has very less debt and has a lean balance sheet
- Care Ratings have given a rating of CARE AA, stable Outlook
- Current Ratio of company stands at 9
- Company maintains low cash balance and invests its excess funds in investments or capital expansions
Cash Flow:
- Has always maintained a positive cash from operations
- Operations are able to fund its investment plans and are also able to provide returns to shareholder in the form of dividend
- Company paid 45% dividend last year
- Co has a healthy CFO/PAT of 1.04 times in last 10 years
Valuation:
| Particular | Current | 52W High | 52W Low | Historical High | Historical Low | Industry Average |
|---|---|---|---|---|---|---|
| Price | 322 | 467 | 298 | 467 | 1.95 | |
| PE Ratio | 26.8 | 42.8 | 24.8 | 71 | 8.4 | 36.02 |
| EPS | 12.01 | 12.01 | 11.08 | 12.01 | 0.1 | 6.35 |
| Price/Book | 4.3 | 7.1 | 4 | 23.8 | 0.4 | 6.15 |
| EV/EBITDA | 18.8 | 27.1 | 17.4 | 44.4 | 0.5 | 22.27 |
| ROCE | 22% | 17% | 10% | 43% | 10% | 17.59% |
- Current price is expected to grow by 2.1times as tabled in Future growth section.
- PE ratio is below industry average and near its 52W low
- Company EPS is growing and is expected to grow by 30% by FY26/27
- Co is demonstrating high ROCE. Historical low is during COVID times
Company has demonstrated a strong P&L growth by venturing into new markets and by creating branks to cater to different customer segments. Further company has maintained a constant OPM of 38%. Company has maintained a lean Balance sheet by taking very less debt and funding its expansion activity by cash generated from operations. Excess Cash is either invested in good investments which help cover for other expenses, interest and depreciation costs. Company also repays back money to its shareholder in the form of dividend.
Future Growth:
| Amt (INR Cr) | 20/21 | 21/22 | 22/23 | 23/24 | 24/25E | 25/26 E | 26/27 E |
|---|---|---|---|---|---|---|---|
| Sales | 211 | 323 | 452 | 391 | 431 | 594 | 772 |
| GP | 69 | 122 | 172 | 151 | 164 | 190 | 246 |
| PBT | 64 | 117 | 165 | 160 | 157 | 182 | 237 |
| Net Profit | 50 | 87 | 123 | 133 | 115 | 133 | 173 |
| EPS | 4 | 8 | 11 | 12 | 10 | 12 | 16 |
| PE | 50 | 44 | 31 | 27 | 36 | 36 | 44 |
| Price | 222 | 347 | 340 | 322 | 370 | 429 | 682 |
Sales Growth :
- 24/25- Expected to grow at 10%. Historical sales trend shows that company grows for around 10% for 2-3 years before taking big leap of 30%-40%
- 25/26- Expected to grow at 10%. Company will enter into Borosilicate market which is currently a 600 Cr Industry and it’s assumed that company will be able to capture 20% market share due to penetration from its existing channels
- 26/27- Expected sales growth by 30% which is proved by historical data trend
Gross Profit:
Gross Profit rate is at 38% which company has maintained historically. For lunch and micro ware business, gross profit is considered at 8% same as Borosil.
PBT:
Company converts 96% of its gross margin into net profit due to low interest and depreciation cost and high interest income received from its investments.
Net Profit:
Tax rate is assumed to be at 27% same as Tax paid in last year
PE Calculation:
- 24/25- 36 PE is mean PE at which stock traded in past 1 year
- 25/26- Same PE is continued in FY25/26
- 26/27- PE of Borosil is given to the share due to venturing in lunchbox and microwave segment
Disc- Invested