
Hoping adding numbers here wont jynx my portfolio (touch wood)
Posts tagged Value Pickr
Poor guys small portfolio (22-10-2024)
I guess everybody has an investment style
N i guess my kinda game is value picks.
So i can only see value in financials atm( i cannot buy stocks at 80-90-100 pe).
Im comfortable holding a hdfc bank for the last 5 yrs tho it has done nothing and im even comfortable holding it for the next 5yrs even if it does nothing. (Reminds me of a warren buffet quote “u will be buying groceries tomorrow,next week, next month n so on so u want prices to go up or down”)
started with 3 lakh but now its close to 40
Still small hoping to get it to 1 cr in the next 3 yrs (fingers crossed)
Gandhar Oil Refinery Limited – India’s largest White Oil player (22-10-2024)
Background
Gandhar Oil Refinery India Limited (GORIL), incorporated in 1992, is engaged in the business of specialty oil industry. The Company was started by Mr. Ramesh Parekh, who is also the current chairman. He has spent over three decades in the industry. The day-to-day operations are managed by his sons, Mr. Samir Parekh, and Mr. Ashlesh Parekh, both of whom have over a decade of experience in the industry. The long operational track record and experience of the promoters have helped the group achieve a relatively large scale of operations and establish relationships with reputed clients and suppliers.
Product segment
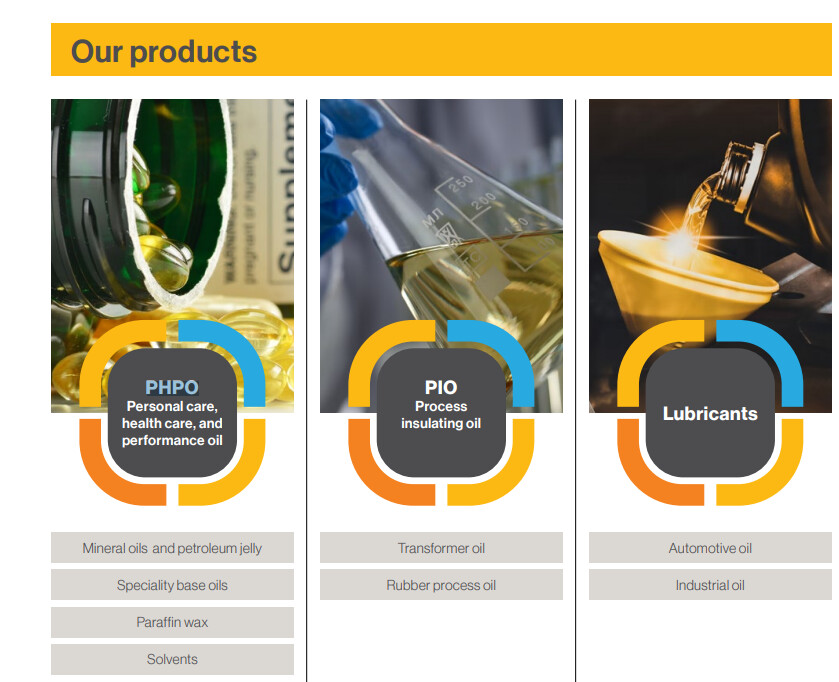
GORIL manufactures products like white oils and other allied products that have applications in the below 3 primary industry, however management thrives to focus on PHPO segment
- Personal care, health care and performance oil (PHPO – 52.3% of FY 24 revenue)
- Process Insulating oil (7% of FY 24 revenue)
- Lubricants (31% of FY 24 revenue) – Own Brand Divyol
Remaining 10% of the revenue comes through the sale generated from channel partners.
The company exports to 100 plus countries and claims to hold 9% of the global white oil market share. Oversees contributed nearly 59% of the total revenues in FY 24.
Product usage
Personal care and cosmetic products – such as moisturizers, cosmetics, skincare products, baby products, hair oils, shampoos, body lotions, fragrances, and creams.
Pharmaceutical sector (pharmaceutical-grade white oil) known for its purity, is integral in the manufacture of vaccines, lubricants for capsules, pelletizing aids, base formulations for ointments, and laxative jellies.
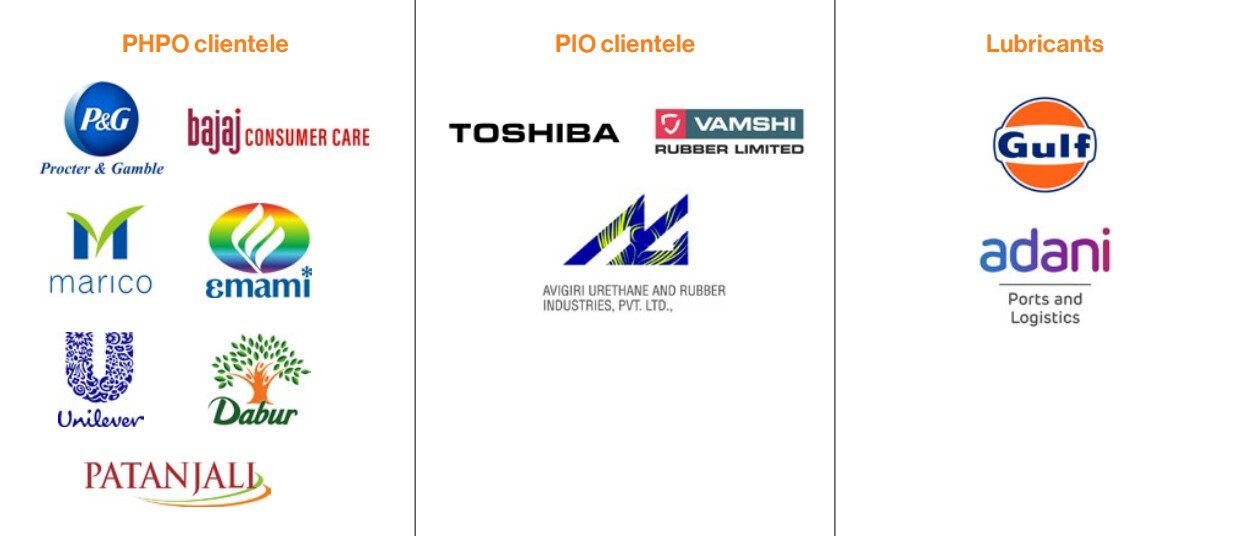
Key Clientele across the product segments:-
Manufacturing capabilities
GORIL is one the largest White Oil manufactures of the world and has manufacturing capabilities of 597,403 KL as of 31st March 2024, split into three regions:-
- Taloja – 218,256 KL of which 75,000 KL has been added in March 2024 itself.
- Silvassa – 143,853 KL (Currently capex is going on in the Silvassa premises for additionally 18,000 KL of capacity which do be completed by end of FY 25)
- Sharjah – 235,294 KL (Managed through Subsidiary – Texol Lubritech FZC, in which GORIL holds 50.10% stake)
The manufacturing facilities are well certified. ( ISO 45001, ISO 14001, Maharashtra FDA, FSSAI)
About the Industry:-
In 2023, the global white oil market was valued at USD 43,723.23 million. The size of this market is expected to increase to USD 57,536.79 million (roughly INR 482,000 crores) by the year 2030, while growing at a compounded annual growth rate (CAGR) of 4.0%. Rising demand for personal care products such as skin care is expected to propel the growth of the mineral oil market. Pharmaceutical and personal care sector contributes 40.5% and 35.91% respectively.
The Indian white oil market size is expected to register a modest growth at a CAGR of 1.80% for the time spanning 2024 to 2032. The key market drivers are the growing utilization of white oil
in various applications such as personal care and cosmetics, pharmaceuticals, and food.
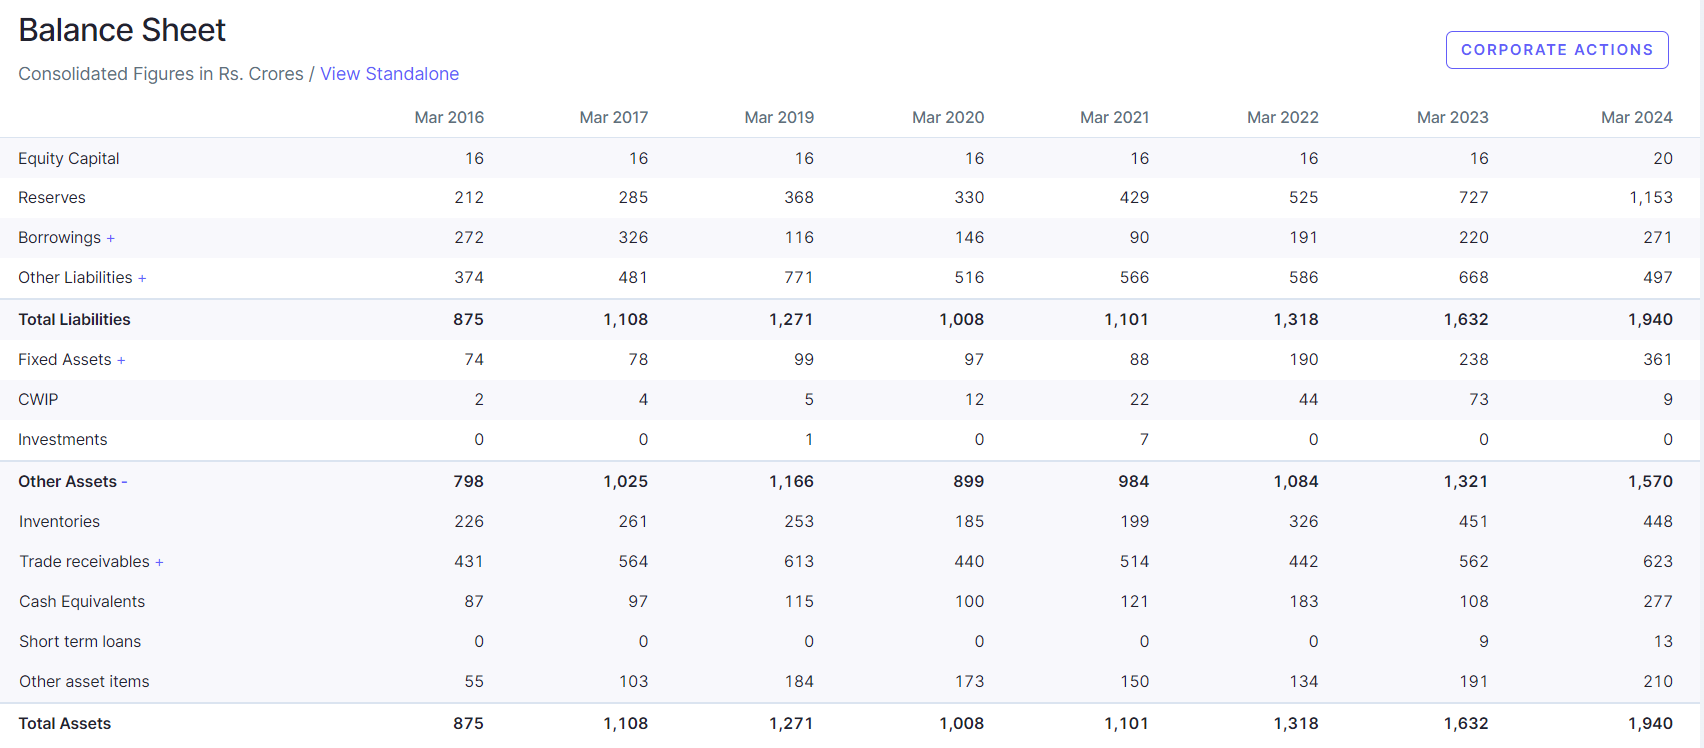
Financial Snapshots:-
The topline CAGR in the past 7 years – 12.5%
Bottom line CAGR in the past 7 years – 30%
However in the last 3 years the company has been able to grow its topline by 23% and bottom line by 18% with an increase in EBITDA margin from 6 to 8% during that period. The growth in topline was seen in the years before the IPO (IPO was in Nov 2023), company has posted flat results from thereon.

Company is a net debt free company and has increased its asset base quite significantly in the past 3 years.
Positives for the company
- Management claims 12-15% volume growth yearly on back of increase in capacity utilization of the Sharjah plant (currently capacity utilization is 65% and management expects it to reach 90% in 2 years) and scaling up of the enhanced capacity installed in the Indian plants (The Indian plants are running at 90% + capacity and scale of enhanced capacity will take 2-3 years).
- Increase in EBITDA margins as capacity utilization increases and product mix changes, PHPO have better margins (10-15% better than the blended products) and management aims to further increase the share of PHPO in total revenues.
- Growing demand of Pharma and Personal health care sector both in India and rest of the world, owing to increase consumer spending.
- Strong customer base, the management claims it takes 3-4 years to onboard a client and slowly slowly the clients starts placing order and the relationship only grows further. This creates an entry barrier and dependence on the company’s product.
- Good rebound of the FMCG and Pharma market expected H2-25 onwards, ultimately white oil is a proxy of these sectors
- Reputed suppliers for Base Oil (Raw material – derivative of crude oil) – Saudi Aramco, S-Oil Corporation, BPCL, HPCL
- Adequate margin of safety – Valuations are reasonable and the IPO froth is over now.
- Pass over contracts – Company claims that few of the new contracts are subject to passing of the volatility in raw material and freight prices to the customer and aims to incorporate such clause as much possible.
Risk Associated
- Volatility in raw material prices have an impact on the margin profile.
- Slow growth in FMCG and healthcare spaces.
- FX risk (company incorporates hedging strategy as well as natural hedge takes place as export oriented)
- Slow process of new customer empanelment (As product quality is very critical else may have adverse impact on the clients end product). This also makes it difficult to onboard a new client, as stickiness in this business is heavy.
- Not such strong presence in the Lubricants and Transformer oil segments.
Disclosure – Initiated a tracking position and might scale up and hence biased.
Chennai petroleum (22-10-2024)
This loss is glaring as in the past 13 Qtrs ,since Jun 2021 the company has been reporting only profits.
Lemon Tree Hotels – Market leader in mid-priced hotel sector (22-10-2024)
While analyzing the hotel stocks, it’s important to see where do we stand in the current cycle, while, no one can predict it accurately but an idea from the last cycle, which started around 2004 and lasted till 2008, can help in understanding. In my views occupancies for the hotel stocks have peaked and Revpar (occupancy*ARR) has only one leg (ARR) to take it forward from here, we have seen same in hotel stocks valuations also, where valuations seems to be peaked and now only the earnings growth will take it forward…
I made a detailed video on the current cycle and compared it with last cycle with the help of few industry reports of that time and annual reports of Indian hotels and EIH hotels. Video is pinned in my X account, watch and share your feedback.
X-@amitsinghpal
BLS International (22-10-2024)
Hi All, Does this recent acquisition SLW Media make sense?
BLS International (22-10-2024)
Hi All, Does this recent acquisition SLW Media make sense?
Indian Hotels–for long term portfolio stability (22-10-2024)
While analyzing the hotel stocks, it’s important to see where do we stand in the current cycle, while, no one can predict it accurately but an idea from the last cycle, which started around 2004 and lasted till 2008, can help in understanding. In my views occupancies for the hotel stocks have peaked and Revpar (occupancy*ARR) has only one leg (ARR) to take it forward from here, we have seen same in hotel stocks valuations also, where valuations seems to be peaked and now only the earnings growth will take it forward…
I made a detailed video on the current cycle and compared it with last cycle with the help of few industry reports of that time and annual reports of Indian hotels and EIH hotels. Video is pinned in my X account, watch and share your feedback.
X- @amitsinghpal
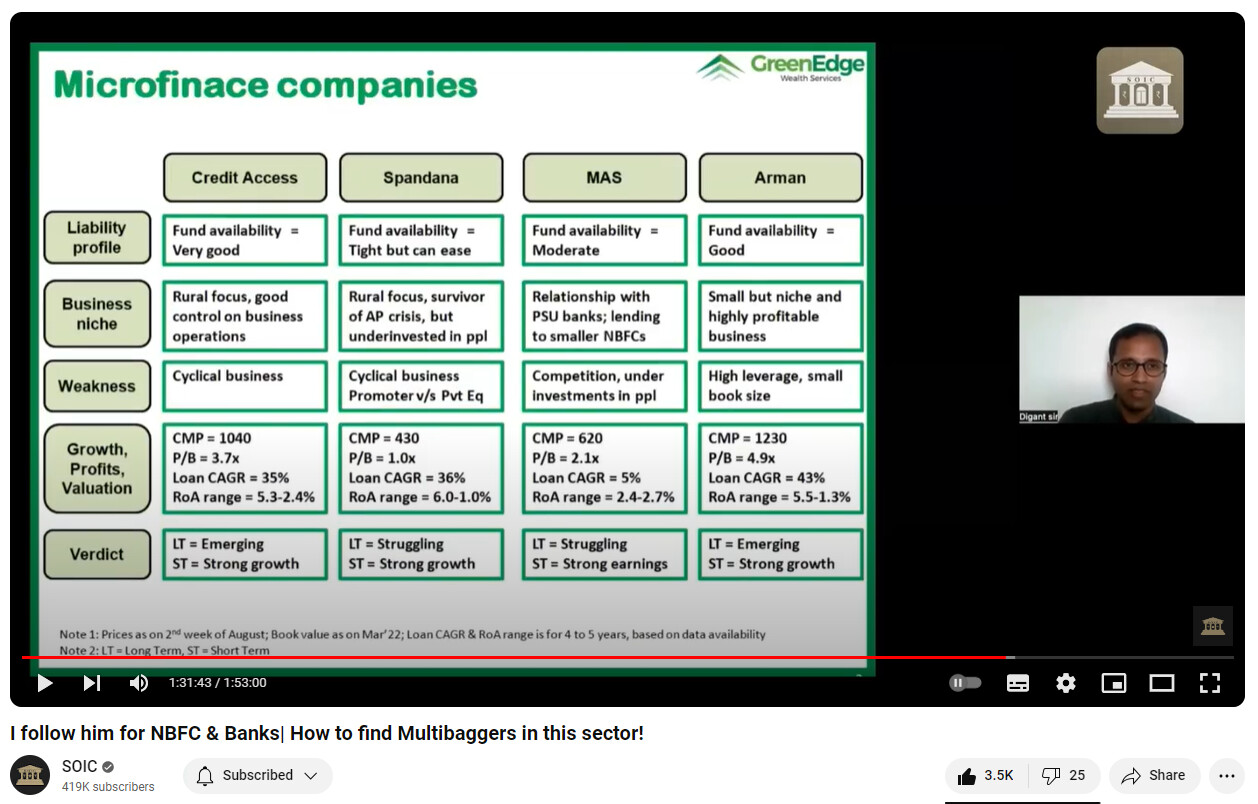
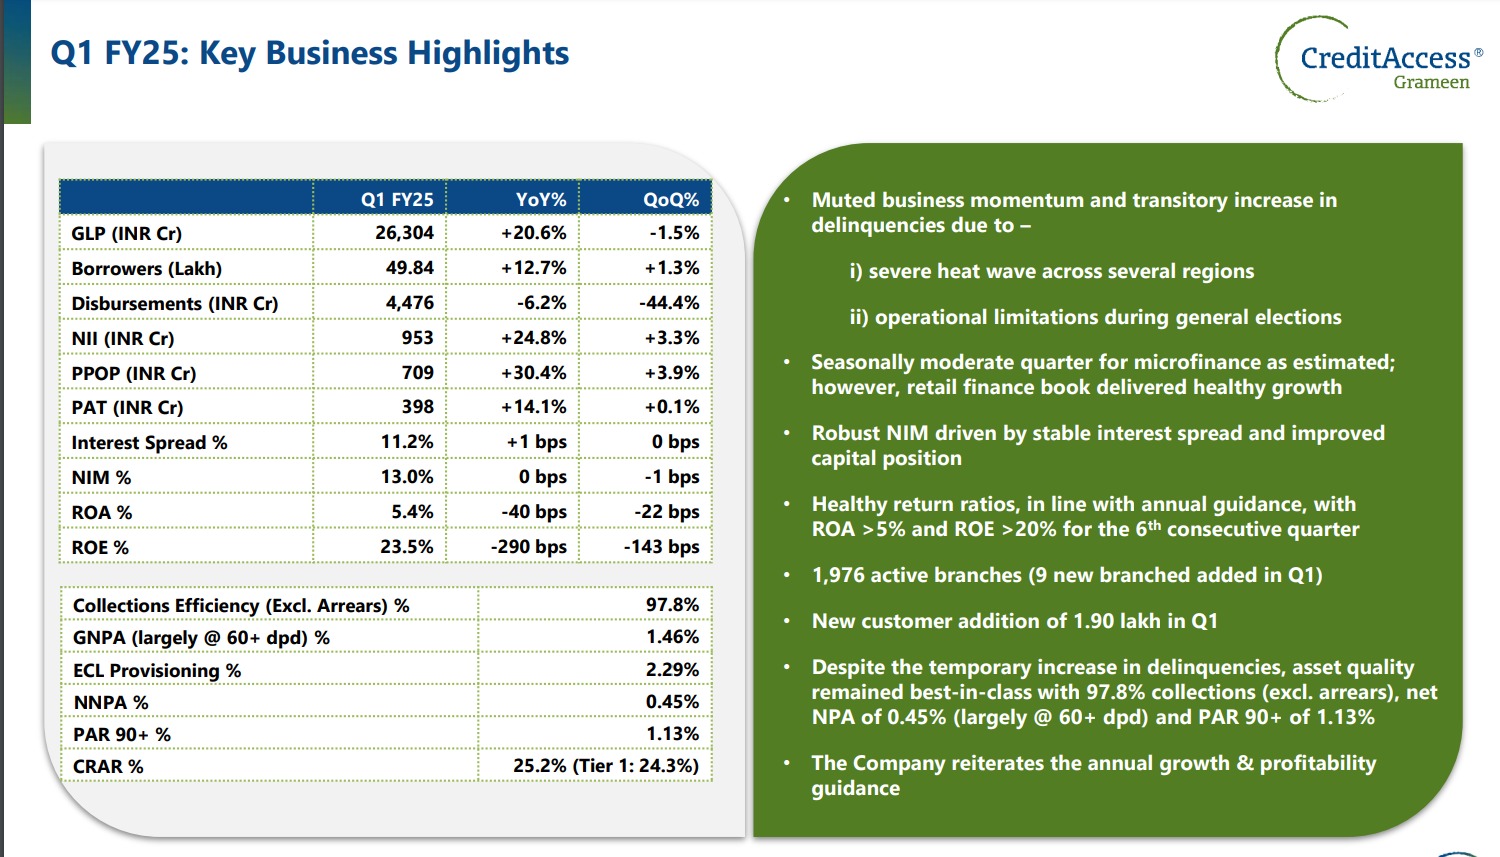
CreditAccess Grameen: Traditional MFI model, efficiently operating at scale (22-10-2024)
CreditAccess Grameen is looking attractive after the recent sell-off for a few reasons:
- Largest amongst the NBFC micro-finance cos. with 5M+ customers across 16 states; They’ve developed the largest network and knowledge within the rural lending space
- They have the lowest lending rate amongst microfinance cos (~21%)
- Growing at 20% CAGR; this is bound to slow down in the future, but there is still a lot of room to grow and I also expect them to increase their market share due to their best-in-class interest rates
- Financially conservative; NIM of 13%, ROE of 23.5% and CRAR of 25.2%
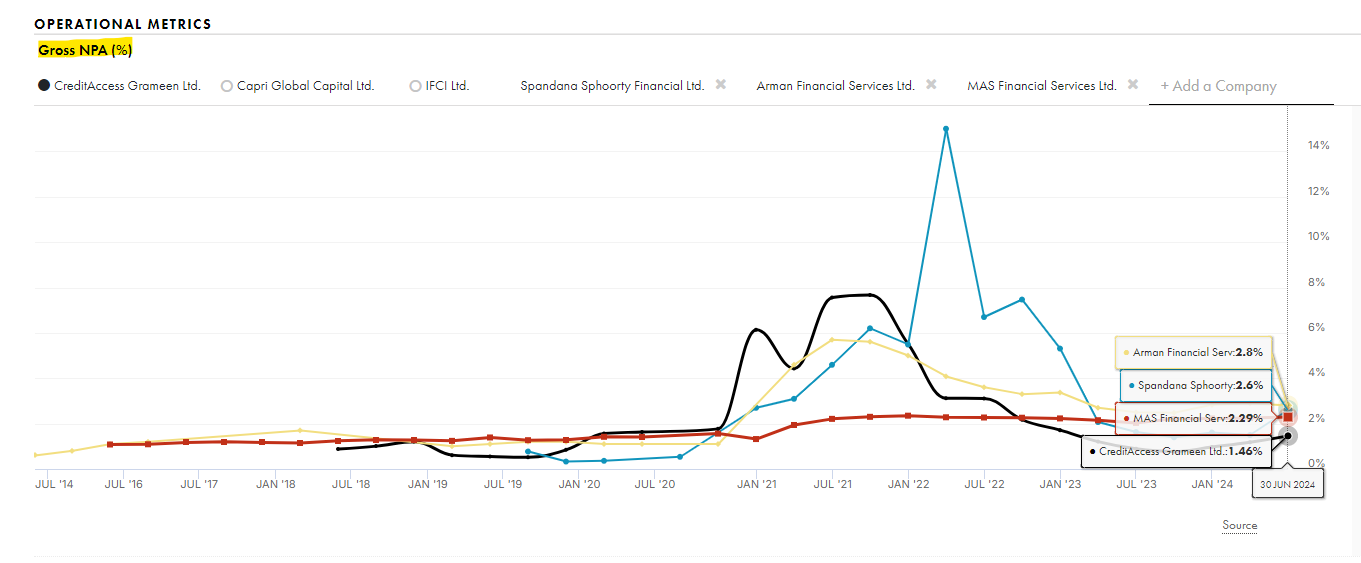
- Seem to be lending conservatively as well: GNPA of 1.46% and NNPA of 0.45%. However, this could shoot up in case of economic distress (GNPA went to 7.6% during COVID)
- Current PE of 10 & earnings yield of 9%+
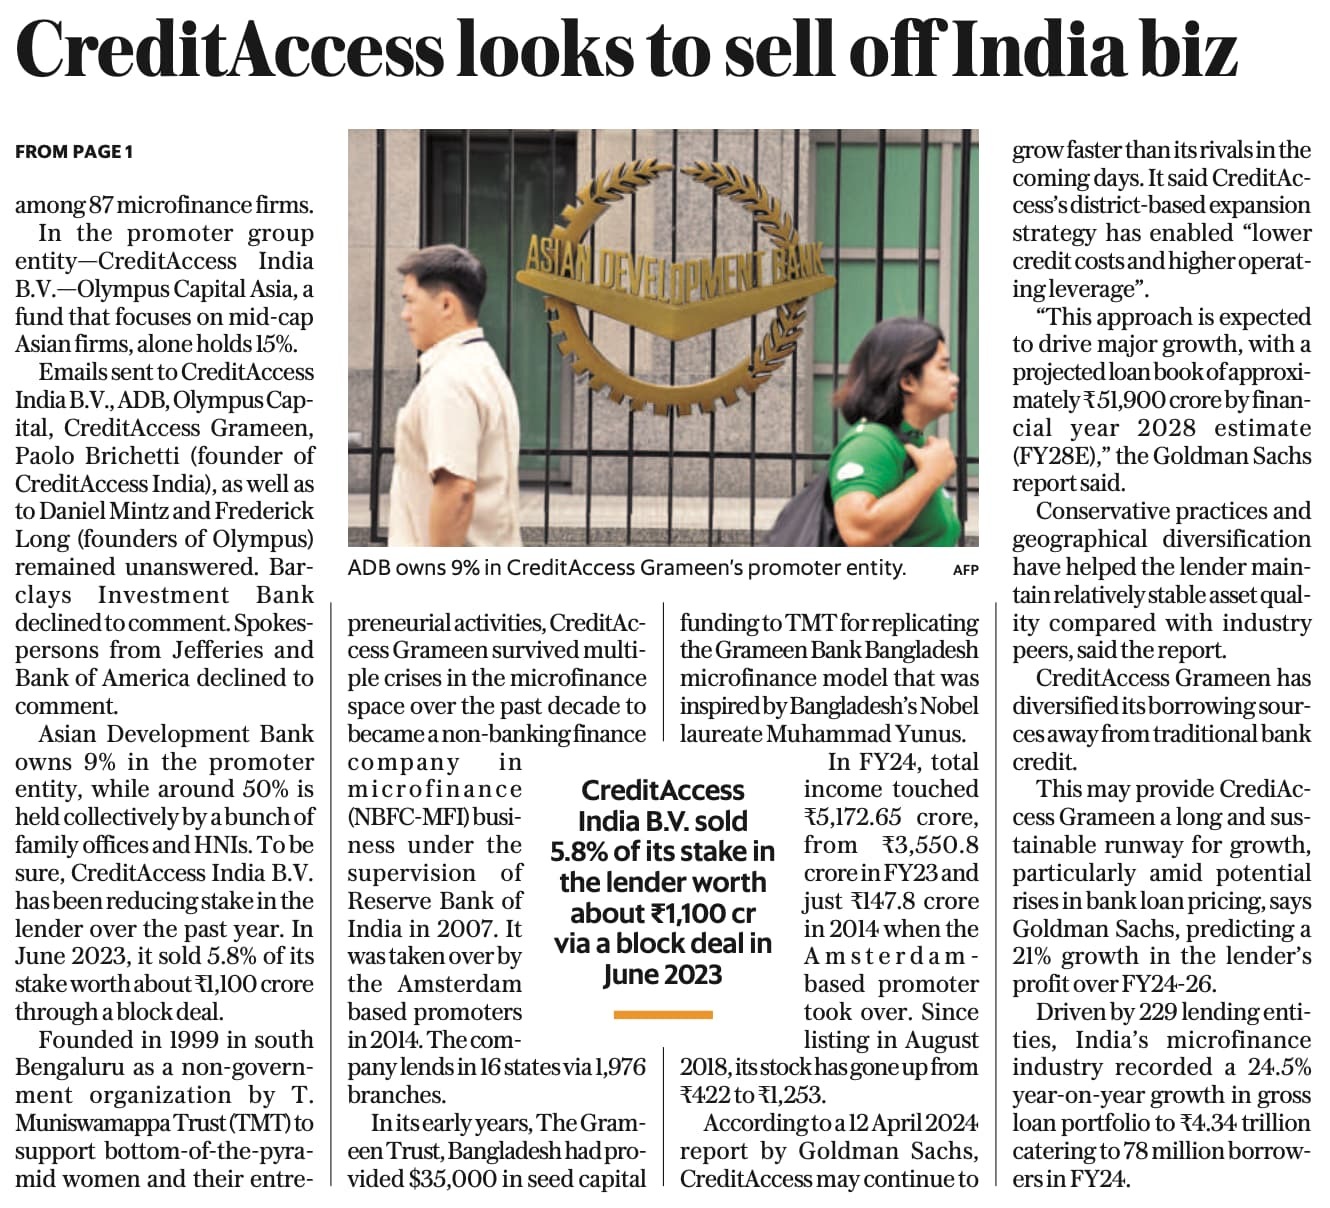
- Paolo Bruchetti, a Dutch national, is the prompter with 66% ownership. Both him and the current management team have a long track record of successful growth and zero frauds that I could find
- Microfinance industry will exist and thrive for the next few decades, as there is still a large percentage of the population that doesn’t have access to traditional banking products or wouldn’t be able to get approved for low interest loans
One of the reasons that the stock has dropped is the concerns over their promoter selling off their stake. However, the promoter is not involved in day-to-day operations even today, so I don’t expect any major changes to management team or company culture.
I didn’t find any obvious red flags, so seems like a great long-term opportunity. Please let me know if I missed any major points.
Sources & further info:
GreenEdge:

Tijori (GNPA):

Disc: recently bought a small position; Will monitor this for the next few quarters and decide whether to increase my holding.
Cheers,
Sharad
OpenSourceInvestor