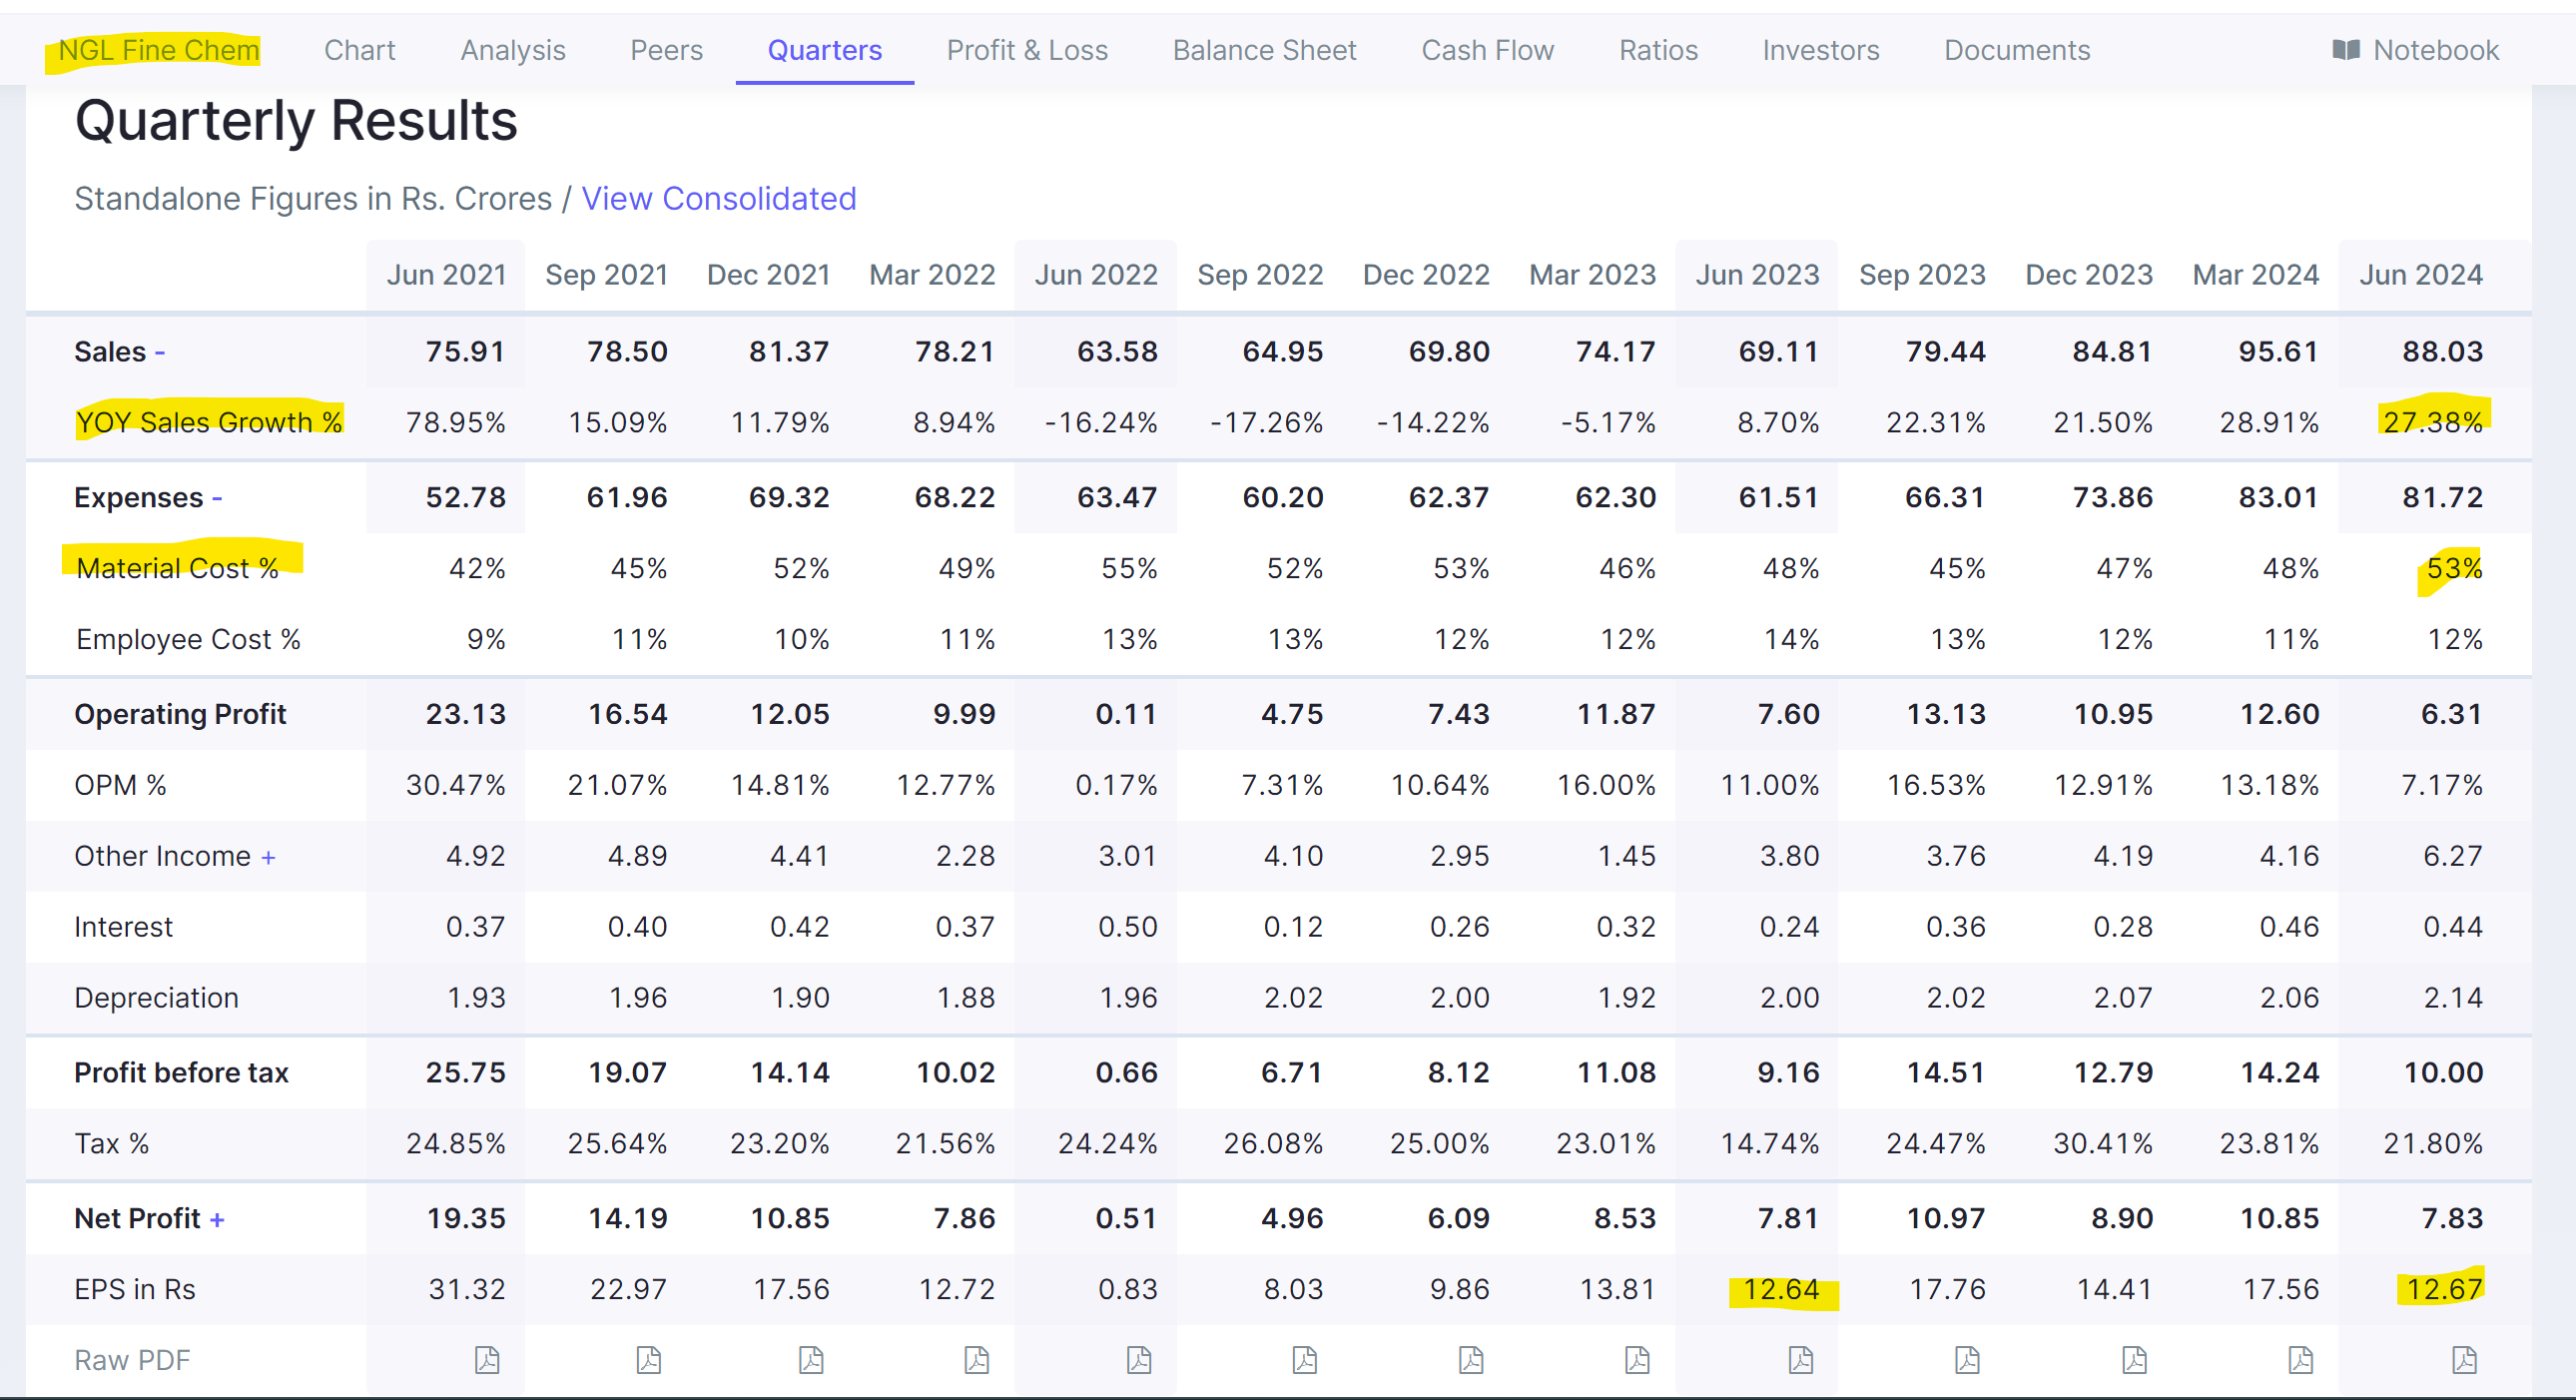
On the call yesterday, new CEO, Mr Kotecha sounded very negative on pressure from China (especially on agchem). 70-80% of portfolio is affected by Chinese competition. Management also withdrew EBITDA guidance.
Disclosure: exited my position today

On the call yesterday, new CEO, Mr Kotecha sounded very negative on pressure from China (especially on agchem). 70-80% of portfolio is affected by Chinese competition. Management also withdrew EBITDA guidance.
Disclosure: exited my position today
Should know a thing that microfinance it self is a very risky business model to invest in, due to their cyclicalality.
BLS International
Its not a new Movie, it’s a repeat of already played movie
Table of Contents
What made me look at this company at first sight?
60% ROCE (excl. cash) business with negligible leverage on balance sheet
Video Links:
**Company Rating**
| Criteria | Description | Rating (Out of 10) | Comments |
|---|---|---|---|
| Business Model | Evaluation of the company’s business model and market positioning | 8-9 | BLS is a uniquely positioned B2G and B2B business with negative working capital |
| Innovation | Assessment of the uniqueness and innovation of the product/service | 7-8 | BLS is following the best practices and working on enhancing the whole Visa Application process and e-governance services |
| Market Potential | Assessment of market size, growth potential, and competitive landscape | 8-9 | BLS has right to win in an oligopolistic and growing market. Digital services also have a decadal headroom ahead |
| Financial Health | Analysis of revenue growth, profitability, and financial stability | 8-9 | Double digit revenue CAGR and operating leverage in full swing, the company can grow bottom line at much faster pace in both verticals |
| Management Team | Experience and track record of the promoters and management team | 8-9 | Promoters have built the company from scratch. No corporate governance issues yet. No significant RPT. Transparency in report is some that company is catching up on |
| Capital Efficiency | Efficient use of capital and funding history | 8-9 | The company raised xx in IPO in 20xx and hasn’t raised any round yet. Company’s propensity to generate cash is very high |
| Valuation | Comparison of current valuation with industry peers and potential growth | 6-7 | It is available at 19-21x FY26E EV/EBITDA at CMP of 580. Its expensive w.r.t peers but deserves a premium |
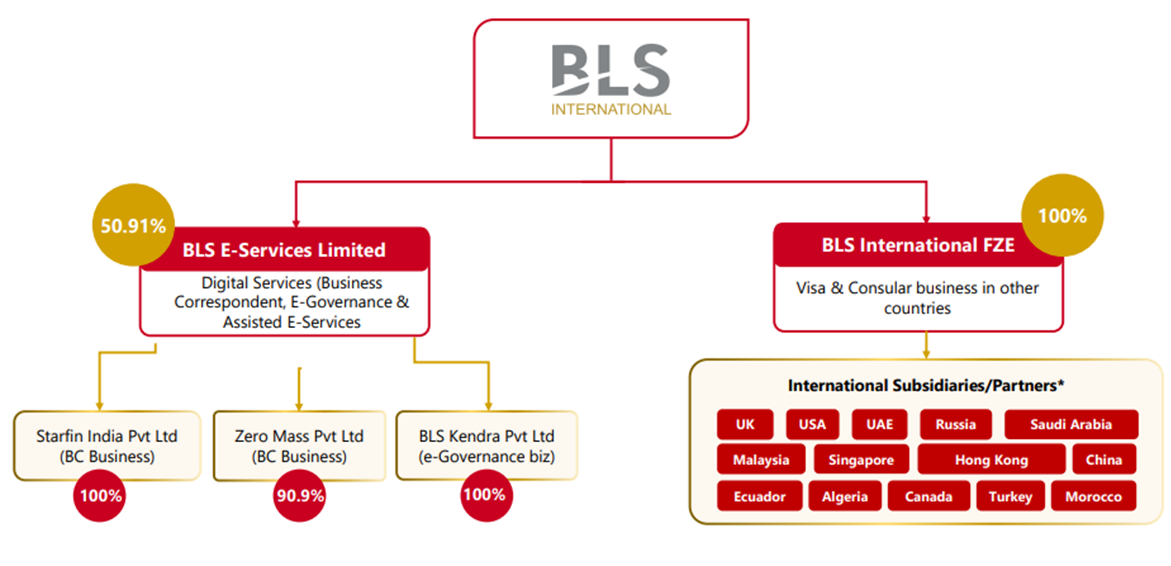
BSL International – 2 distinct companies under 1 Umbrella
Both the companies are very distinct from each other due to the following reasons –
Since Inherently, both the businesses are distinct and listed separately (recently), we will discuss the businesses separately
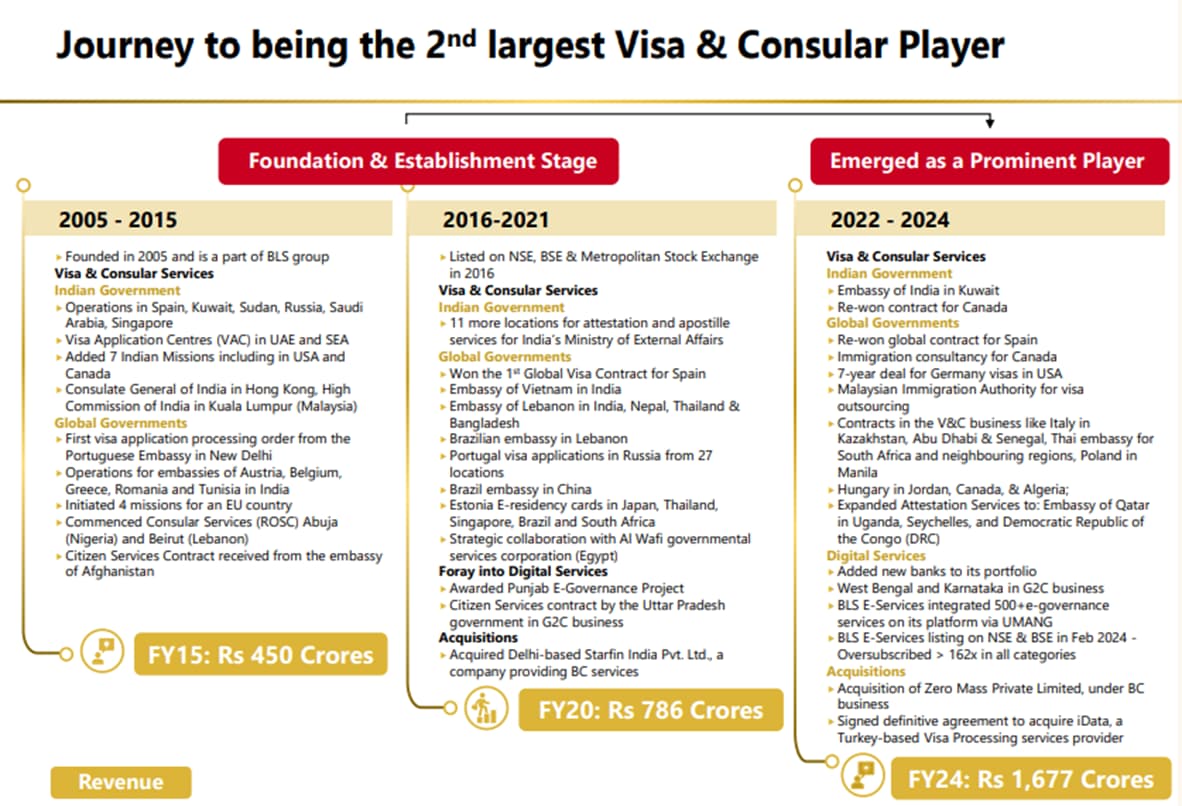
The Story Behind BLS
Before we start discussing BLS international, we should look at the journey of VFS global. This will give us an idea of where is BLS placed in the growth cycle.
VFS Global Journey
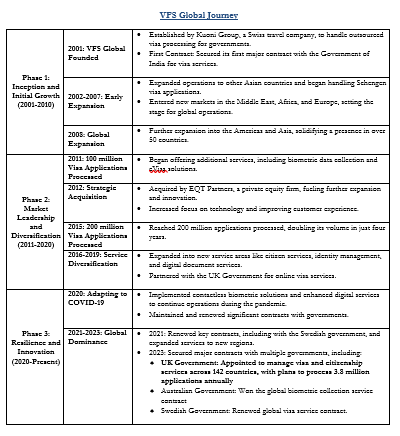
Key Points to Note –
**
Where is BLS in the journey
**
• BLS seems to be currently in Phase 2 – Market Leadership and Diversification, were
o They are acquiring regional players
o Diversifying into citizen services and other ancillary services
o Changed the business model from partner led office space to own office space
o Improving margins from 15% EBITDA in FY23 to 27% EBITDA in Q1 FY25
o Bidding for new contracts aggressively
Visa & Consular Services
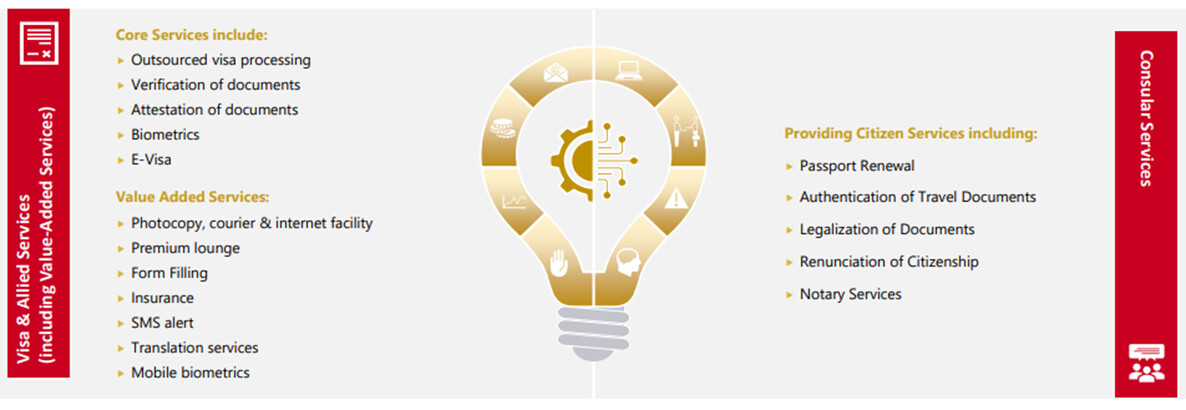
As soon as you start studying this business, you will be able to easily be able to make out few things –
a. VFS global – the company has done more than 4-5 acquisitions across the globe in last 5 years to capture the market share
b. DU Digital Global Ltd – The company has topline of ~INR 29 Cr. The company has just filled a writ petition before the Hon’ble High Court of Delhi. The petition is filed to safeguard against mischievous attempts to scuttle competition and deliberate undercutting and to avail the interim relief.
Investment Thesis
And for now, all the levers are working for BLS international.
o BLS acquired a regional players called iData with the following credentials –
| Particulars | CY2022 | CY2023 |
|---|---|---|
| No. of Applications (in Lakhs) | 5.12 | 7.22 |
| Total Revenue (Rs Crores) | 168 | 246 |
| EBITDA (Rs Crores) | 94 | 144 |
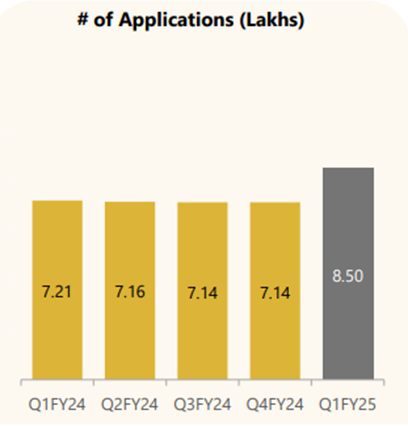
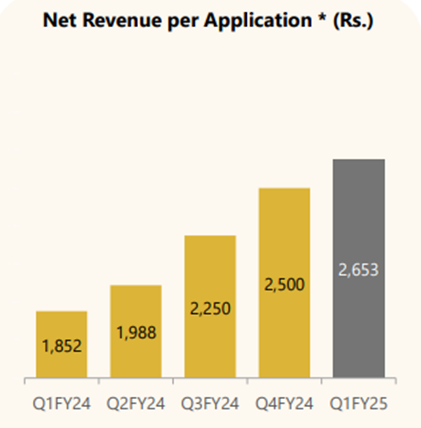
o Due to new contracts won and higher service charges, Number of applications processed and Service charge for processing each application, both the levers are working for BLS International
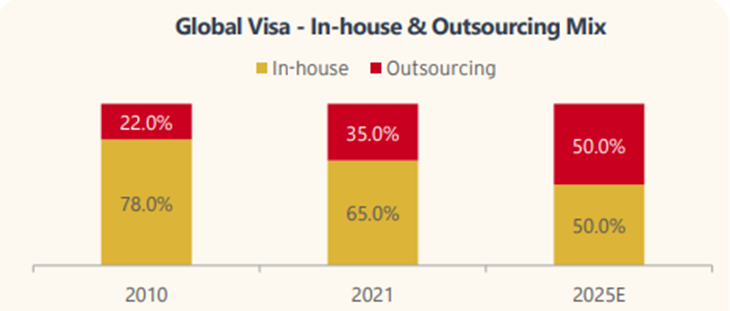
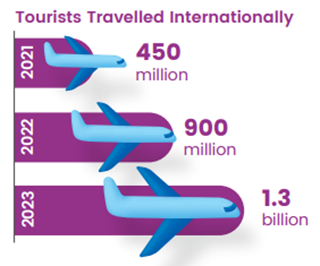
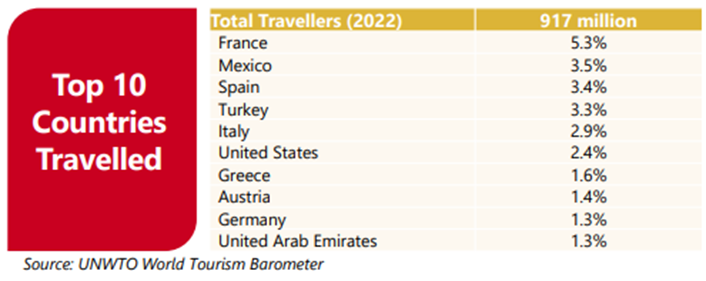
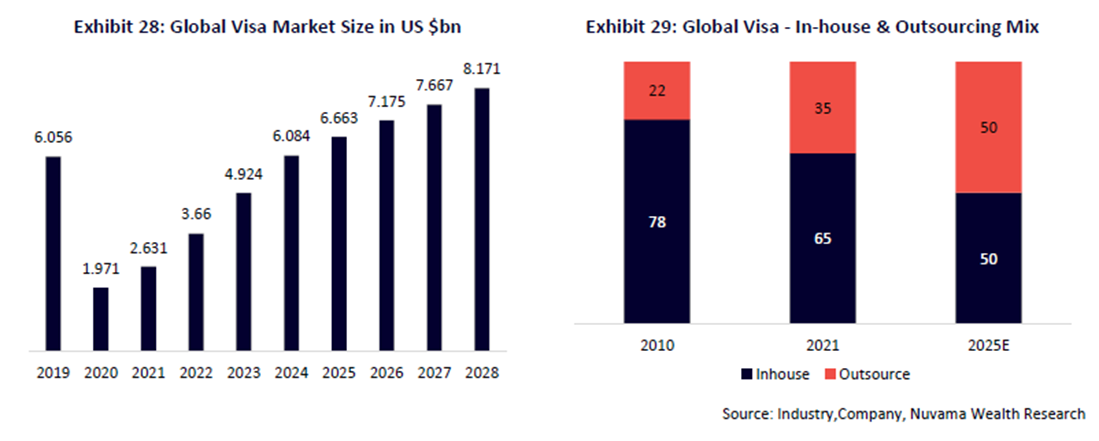
o Last lever for growth, Growth in Outsourcing of Visa Applicable Worldwide to further fuel up the need for global VISA processors like BLS
Competitive Analysis
Looking at the competition is a major factor in making investment decision in BLS (after iData acquisition)
| Parameter | VFS Global | BLS International (Incl. iData) | TLS Contact | VisaMetric | CSC |
|---|---|---|---|---|---|
| Incorporation | 2001 | 2005 | 2007 | 2005 | |
| Headquarter | Zürich & Dubai | Delhi | Luxembourg | London | |
| Parent | Blackstone | NA | Teleperformance SE | NA | |
| Market Share (outsourced Visa) | ~50% | ~15% | ~20% | ||
| Annual Revenue | $ 700-800 Mn | $ 250 Mn | $ 330 Mn | ~$ 50 Mn | $ 50 Mn |
| EBITDA | $ 180-200 million | $ 60 Mn | $ 85 Mn | ~$ 10 Mn | $ 12 Mn |
| EBITDA % of Revenue | 27% | 21% | 21% | 18% | 24% |
| Annual Visa Applications | ~25 Mn | ~3 Mn | |||
| Visa Applications Processed (Cumulative) | – | 360+ Mn | 6.5 Mn | 7 Mn | 2 Mn |
| Client Govt | 68 | 46 | |||
| Global Presence (countries) | 153 | 66 | 62+ | 16 | 20 |
| Number of Application Centers | 3,500+ | 2,500+ | 1,500+ | 100+ | 150+ |
| Employees | 11,000+ | 60,000+ incl. Associates | 6,000+ | 500+ | 500+ |
| Top Countries | UK, Australia, Sweden, UAE | **Germany Italy Spain****US |
India|France, Switzerland, Italy||US|
|Valuation|$2.5 Bn in 2021|$2 Bn in 2024||||
Management Commentary*
Shikhar Aggarwal; Joint Managing Director
“We have transitioned from a partner-backed model to managing our own operations, a move BLS International Services Limited that underscores our dedication to optimizing performance”
Acquisition
Annexure
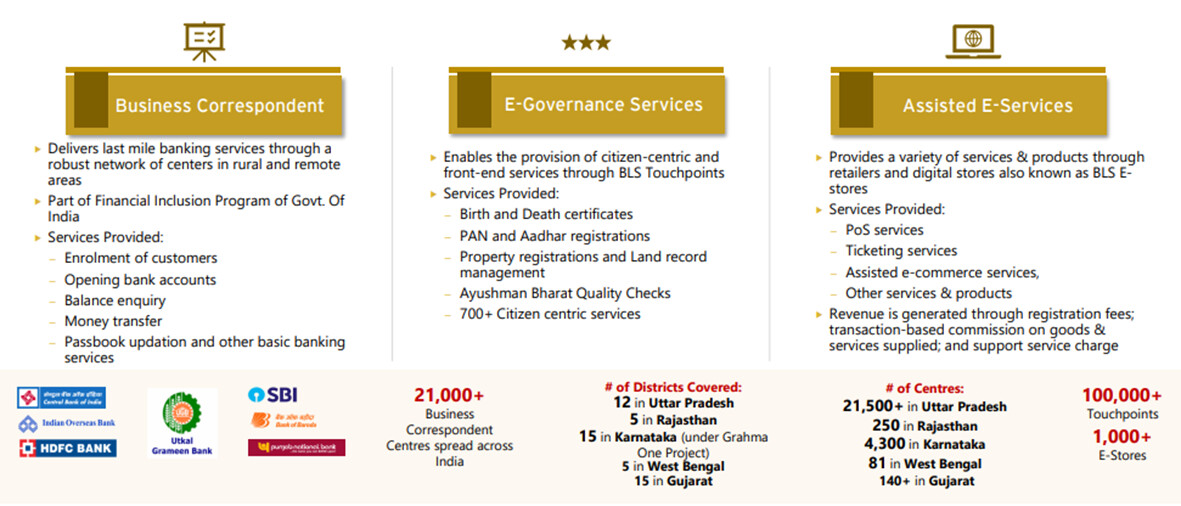
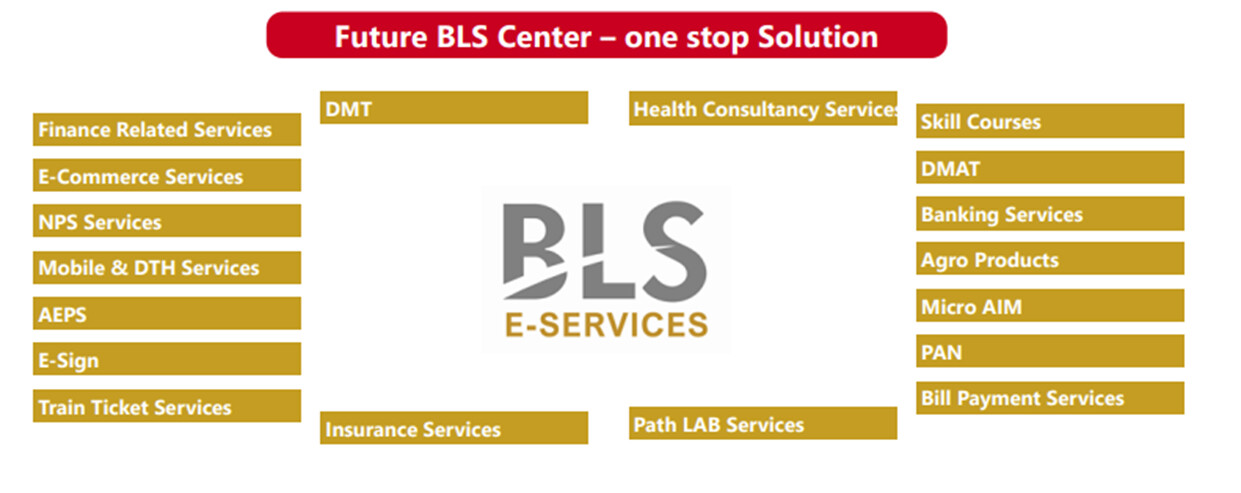
**BLS E-Services**
Shikhar Aggarwal; Joint Managing Director
“The funds raised (INR 300 Cr through IPO) will fuel the expansion of our digital service arm enabling investments in new technology, service offerings and outright efforts”
“Partnerships with public and private sector banks exemplified by initiatives like Har Ghar Suraksha and DBS Dastak underscore our commitment to extending banking services to the underserved population of the country. Our innovative solutions such as the Business Facilitator model and Iris scanner have been instrumental in driving success and delivering value to our partners”
“We have recently launched doorstep banking services tailored for the elderly in 25 states and
union territories, making banks more accessible and convenient for them. This service aims to
address the challenge faced by elderly in accessing traditional banking facilities. Looking ahead,
BLS International Services Limited we are focused on organic growth initiatives and strategic acquisitions to expand our market share and strengthen our competitive position.”
Acquisition
“We signed a definitive share purchase agreement to acquire 55% controlling stake in Aadifidelis Loan Solution and its affiliates, which is one of the largest loan distribution processing companies in India with Pan-India presence. Anetwork of 8,600 plus channel partners enabled Aadifidelis to facilitate average monthly loan disbursement of more than INR1,500 crores”
Key learnings from the Punjab contract
Post the Punjab contract, BLS has decided that it would not pursue any Govt. business where receivables are due from the Govt. The company will participate in contracts only if the revenues are to be collected from Citizens, with a share of revenue going to the Govt.
Post re-contracting of the Punjab contract, the company has entered into two additional contracts with the states of Rajasthan and Uttar Pradesh. In both these contracts, BLS has provided the software necessary to provide services to local entrepreneurs and charges a fee per transaction, making the model even more capital light
Investment Thesis
Estimated Financials
| Year to March (INR Cr) | FY23 | FY24 | FY25E | FY26E | |
|---|---|---|---|---|---|
| Income from operations | 1,516 | 1,677 | 2,250 | 2,700 | |
| Cost of services | 1,029 | 965 | 1125 | 1350 | |
| Employee costs | 140 | 208 | 270 | 324 | |
| Other expenses | 125 | 158 | 202.5 | 243 | |
| Total Operating expenses | 1,294 | 1,331 | 1,598 | 1,917 | |
| EBITDA | 222 | 346 | 653 | 783 |
Few of my takeaways from Q1 FY25 of Aster DM Healthcare
𝐂𝐨𝐫𝐩𝐨𝐫𝐚𝐭𝐞 𝐓𝐫𝐚𝐣𝐞𝐜𝐭𝐨𝐫𝐲:
Aster DM Healthcare’s business outlook appears promising, with the company reporting strong operational and financial performance in the latest quarter. The company’s focus on expanding its hospital network, especially in tier-2 and tier-3 cities, aligns with the growing demand for quality healthcare services in these regions. The management’s emphasis on maintaining sustainable margins and improving operational efficiency suggests a well-planned strategy for long-term growth.
𝐒𝐭𝐫𝐚𝐭𝐞𝐠𝐢𝐜 𝐁𝐥𝐮𝐞𝐩𝐫𝐢𝐧𝐭:
𝐌𝐚𝐫𝐤𝐞𝐭 𝐃𝐲𝐧𝐚𝐦𝐢𝐜𝐬:
𝐈𝐧𝐝𝐮𝐬𝐭𝐫𝐲 𝐓𝐚𝐢𝐥𝐰𝐢𝐧𝐝𝐬:
𝐈𝐧𝐝𝐮𝐬𝐭𝐫𝐲 𝐇𝐞𝐚𝐝𝐰𝐢𝐧𝐝𝐬:
𝐈𝐧𝐯𝐞𝐬𝐭𝐨𝐫/𝐀𝐧𝐚𝐥𝐲𝐬𝐭 𝐐𝐮𝐞𝐬𝐭𝐢𝐨𝐧𝐬:
Analysts raised concerns regarding the performance of the Andhra Pradesh and Telangana clusters, which have lower margins compared to the company’s other regions. The management acknowledged the challenges and provided a detailed plan to improve the performance of these clusters, including optimizing costs, leveraging government schemes, and building on the company’s existing presence in the region.
𝐂𝐨𝐦𝐩𝐞𝐭𝐢𝐭𝐢𝐯𝐞 𝐋𝐚𝐧𝐝𝐬𝐜𝐚𝐩𝐞:
Aster DM Healthcare operates in a highly competitive healthcare industry, with both regional and national players. However, the company’s strong focus on expanding its presence in tier-2 and tier-3 cities, where competition is relatively lower, as well as its emphasis on specialized and quaternary care services, provide it with a competitive advantage.
𝐅𝐮𝐭𝐮𝐫𝐞 𝐏𝐫𝐨𝐣𝐞𝐜𝐭𝐢𝐨𝐧𝐬:
The management has provided a positive outlook, targeting a consolidated EBITDA margin of 20-21% in the medium term and a hospital and clinic segment EBITDA margin of 23-24%. The company’s ability to achieve these targets will be crucial in determining its future performance.
𝐂𝐚𝐩𝐢𝐭𝐚𝐥 𝐃𝐞𝐩𝐥𝐨𝐲𝐦𝐞𝐧𝐭:
Aster DM Healthcare’s capital allocation strategy appears prudent, with the company planning to fund its expansion primarily through existing cash reserves and operating cash flows, without the immediate need for dilution. The management’s openness to exploring inorganic growth opportunities, subject to favorable valuations, is a positive sign.
𝐎𝐩𝐩𝐨𝐫𝐭𝐮𝐧𝐢𝐭𝐢𝐞𝐬 & 𝐑𝐢𝐬𝐤𝐬:
Key opportunities for Aster DM Healthcare include:
Potential risks include:
𝐂𝐨𝐧𝐬𝐮𝐦𝐞𝐫 𝐏𝐮𝐥𝐬𝐞:
The company’s focus on providing quality healthcare services, expanding its presence in underserved regions, and leveraging specialized and quaternary care capabilities suggests a positive customer perception.

The charts suggests the downside shall continue till 71-72 level since the downward moment has started after breakdown from neck level of the head and shoulder pattern.
Did they give any reason for promoter not being present in the call?
This looks bad. Still, there’s sufficient margin of safety considering the stock price and company’s debt is sustainable and the business is cash accretive so no need to panic just yet.
Did they mention anything about addition of new keys, given the 2,200+ target that they had for FY25? Owner being sick is not a good enough reason, why are they not approaching other owners.
How come they didn’t anticipate drop from election when everyone else was expecting it, are they living with their head in the sand?
Sharing the latest investor presentation
https://www.bseindia.com/xml-data/corpfiling/AttachLive/fe9af0f1-c123-4964-a8a1-216792f89924.pdf
History is irrelevant in this stock given the changing business model. Key question to answer is does USL show a QoQ jump between June & September. Here’s the data:-
| June | September | QoQ | |
|---|---|---|---|
| FY24 | 2,667 | 2,867 | 7.50% |
| FY23 | 2,419 | 2,911 | 20.34% |
| FY22 | 1,722 | 2,508 | 45.64% |
One can ignore FY22 as being marred by Covid wave 2, but FY23 and FY24 numbers are pretty evident.
Also another point on capacity – if one has seen the 40-50 minute video of the tour of piccadily, towards the end you can see that in the new warehouse, whiskey is maturing in new barrels since 2022. So its likely they’ll take some of it out for sale in Q3.
https://www.youtube.com/watch?v=ESC6KU1NaXA – see from 37 min onwards
Madhu in this video says, younger barrles have been purchased “over the last few years”. So whiskey etc / liquid is already maturing in some of these barrels. This is confirmed as you move forward in the video & Madhu shows you barrels that have been stocked since 2022. So its likely some of this extra capacity would be released in the market towards Diwali
If I take a 10% QoQ revenue jump for Piccadily, and around 15% QoQ jump in EBIT, we get 132 crs & 34crs of EBIT for Q2. Q3 and Q4 should be bumper given season + extra capacity + new launches (maybe?)