There are few companies which are going to benefit because of DATACENTER business growing in India like Blue Star Ltd.
- Blue Star Ltd –
Please do add companies which are going to benefit because of expansion of DATACENTER business in India.

There are few companies which are going to benefit because of DATACENTER business growing in India like Blue Star Ltd.
Please do add companies which are going to benefit because of expansion of DATACENTER business in India.
List of Data centers companies in India (Listed in NSE or SME platform)
Please add on to this list, the companies into DATACENTER business in India.
Add one another point, which one interesting on commentary
We have around
Rs.800 Crores. Even if you spend Rs.300 Crores to Rs.400 Crores to Rs.500 Crores in the next two years we will have Rs. 1,000 Crores. That is the time you will think of acquisitionof brands, acquisition of companies for domestic business and in addition to that we always look for something unique in the form of acquisition of distribution companies which will make us understand where we will have to sell our generics because generic is a business there is nothing in the form of marketing. Generic business is based on supply and demand.
You only need to understand how many products we have, what is the cost at which we will be able to supply and the quality wise once it is approved by USFDA everybody thinks quality will not be an issue. It is true also. So what is important is the distribution channels and the places where this can be reached by avoiding the intermediaries. Then coming back to one more thing in the form of LATAM, I am sure in five to six years from now we will be the number one company.
Open Eye for such kind of events / steps of the company !!!
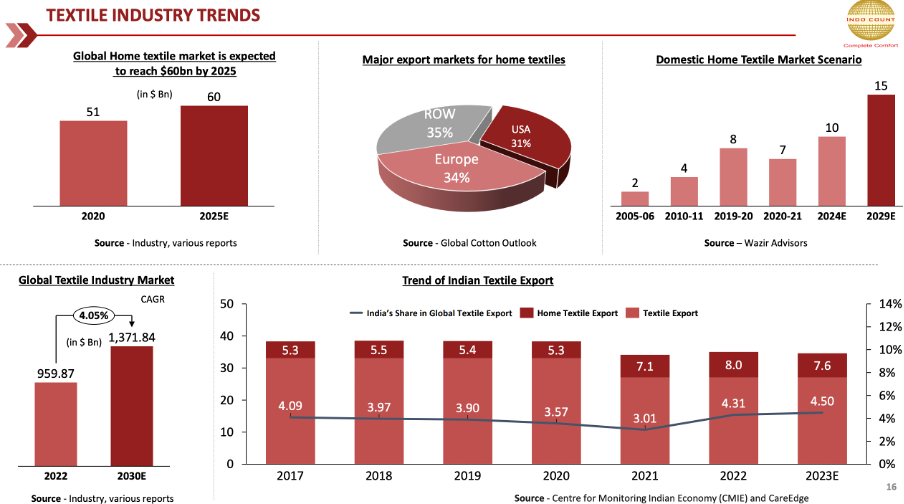
Indo Count is one of India’s largest home textile manufacturer and exporters with an extensive product range, which spans across bed sheets, quilts and bed linen. It has a presence in top nine out of 10 top big box retailers in the US.
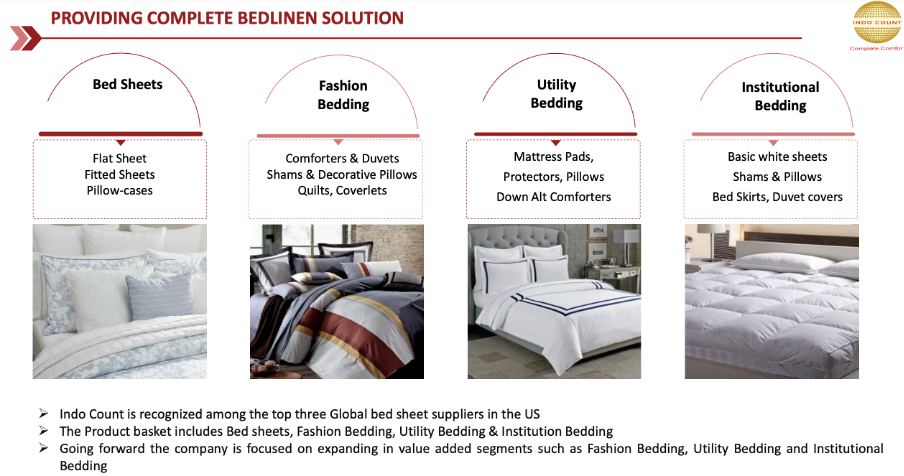
Company aims to double revenue in three-to-four years. It is focused on increasing the contribution from institutional bedding, fashion utility, e-commerce, and the domestic business.
The management expects demand in the US market to be better in FY25 as compared to FY24 and market to grow by 5-6%.
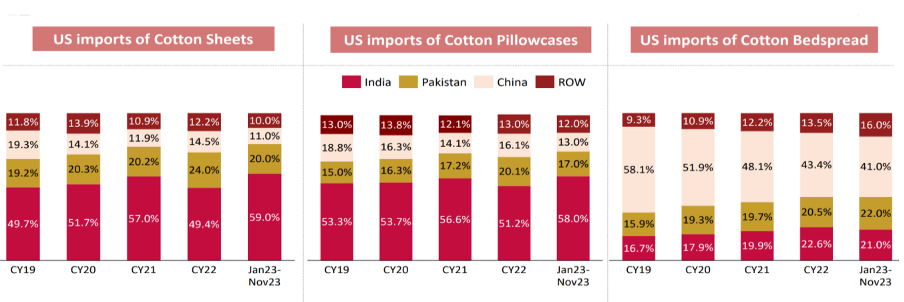
ICNT gains from the rising share of Indian home textile players in the US market driven by the China+1
The management is confident of achieving volumes of 90–100mn meters with 16–18% margin.
Greater contribution from value added and fashion bedding to 30% from 19% in FY23 and operating leverage will result in margin expansion.
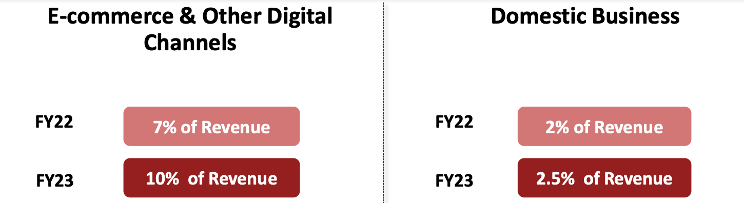
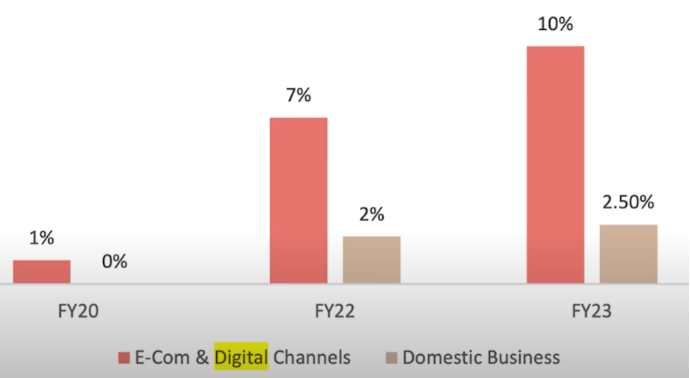
Company aims to grow the domestic businesses at an exponential rate and expects 10% contribution from the e-commerce segment.
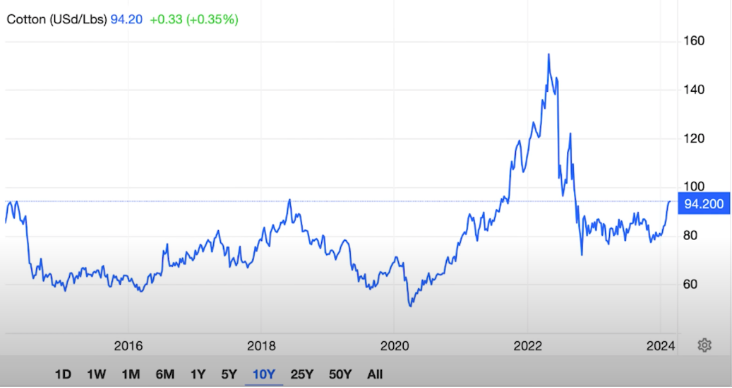
Cotton arrivals in the market are healthy. Higher international prices are behind the recent run-up in cotton prices. The management said this run-up was driven by speculation and added that it doesn’t affect the company as it has hedged input cost till October.
Market cap = 7013 (>1000 cr)
PE = 20.6 < 43 industry PE)
PEG = 1.20 (should be < 1)
ROCE = 15.1%
ROE = 15.43% ( neutral)
D/E = 0.47 ( should be < 1)
CAGR sales growth 3 yrs = 13.1%
CAGR profit growth 3 yrs = 21.8%
EV/EBITDA = 13.4 (which is > 10)
Operating margins = 16.6%
Total reserves increased = YES
Total borrowings decreased = YES ( from 2022)
Total fixed assets increased = YES
Cash flow from Operations in Last 3 years (Positive + sequential growth ) = No, sequential growth
Net Cash flow for last 3 years (Positive + sequential growth) = No, sequential growth
Debtor days – reduced from 62.6 to 49.6
Inventory days – reduced from 238 days to 220 days
Days payable – increased from 40 to 61
Cash conversion cycle – reduced 258 to 224
Working capital days – slight decrease from 189 to 150
• Consistent growth of FIIs and DIIs and Stable Promoter holdings
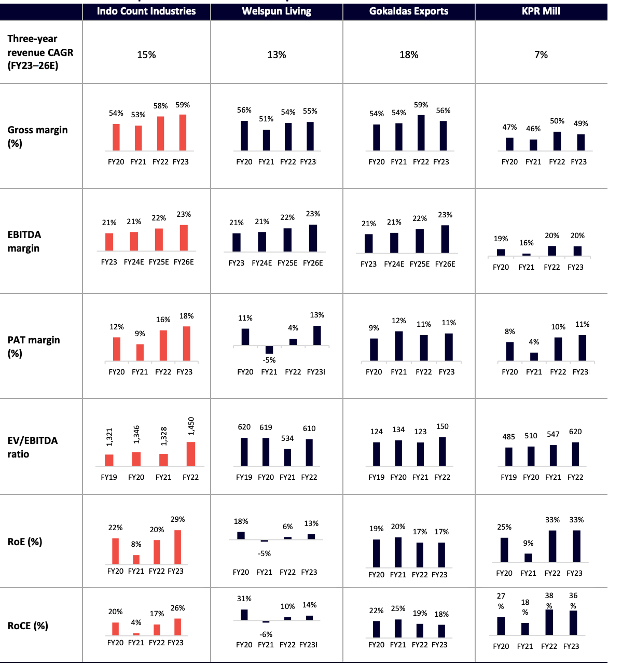
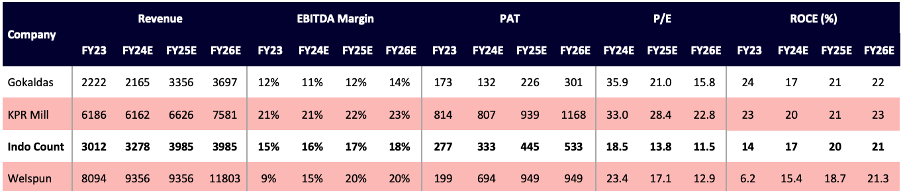
Peer Analysis
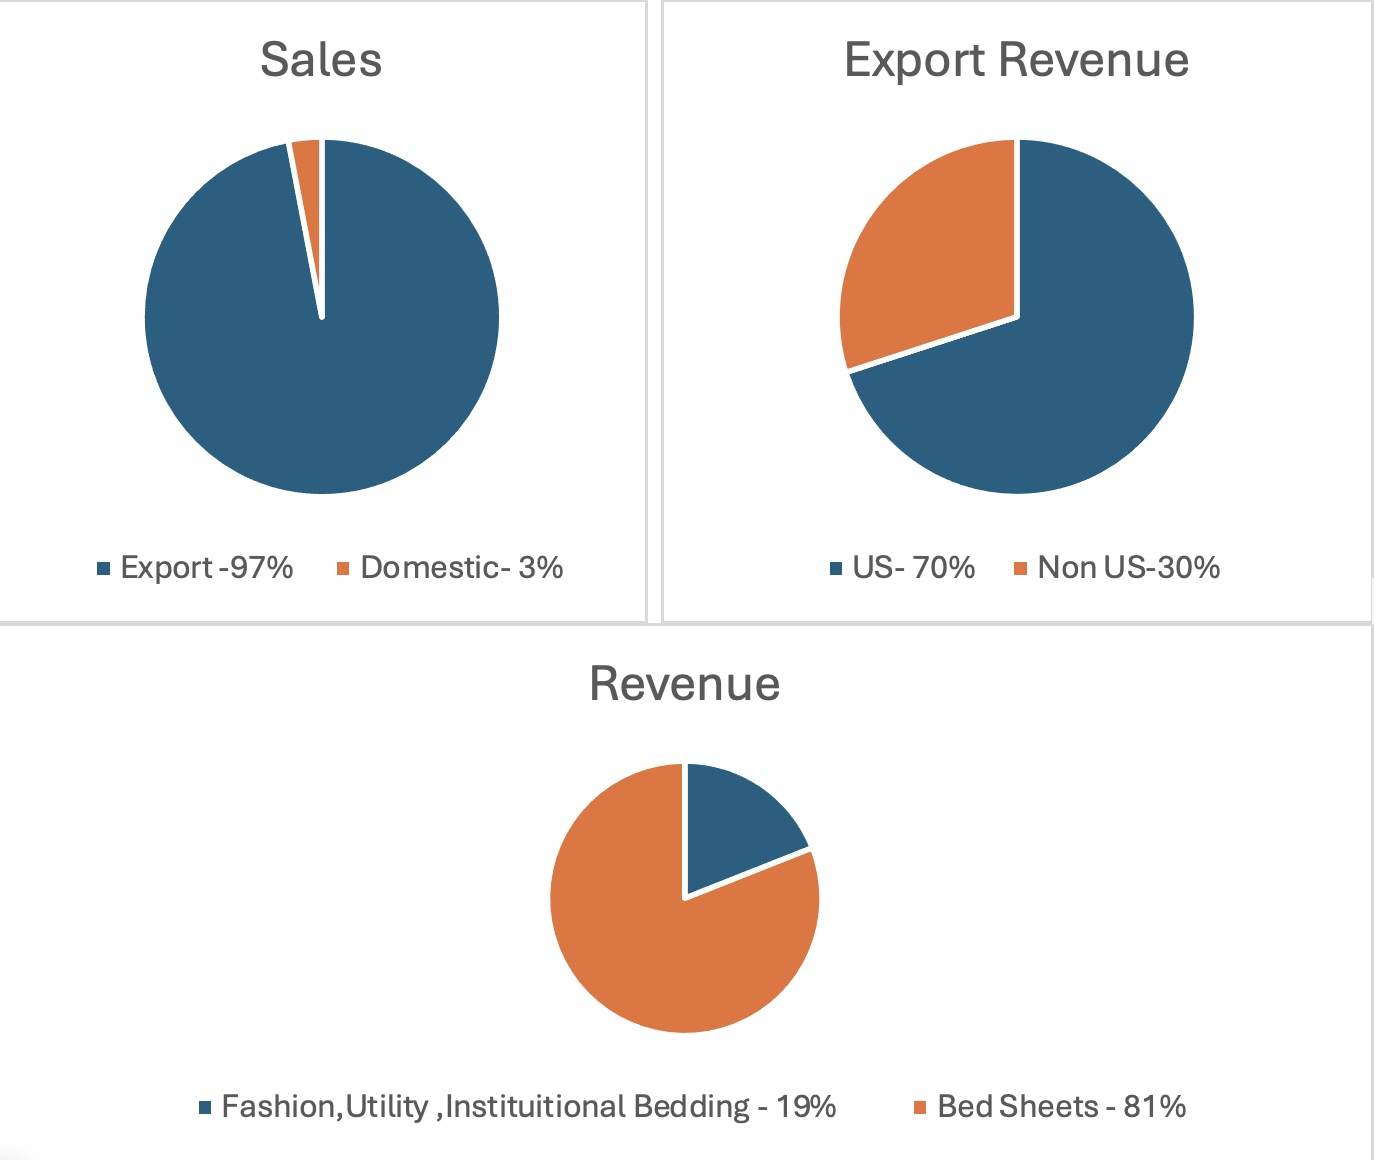
UK and Europe together around 15% of business on the revenue side
Home Textile Market: 2.5 billion dollar
Value Added Market: 11 billion dollar
Stock is showing trend to grow in near term by an upside by 30%, As company achieves volume growth guidance in Q4 and show growth in FY25,
Disclaimer: Not yet invested, Planning to invest
![]() Robust Orderbook
Robust Orderbook
M. E. Energy orderbook- 118.5cr. (recent acquisition)
FY24 estimated closing orderbook- 330cr+
Order Enquires- 1000cr!![]()
![]() Management Guidance:
Management Guidance:
![]() FY 24 revenue: 330 cr
FY 24 revenue: 330 cr
(Reduced from earlier guidance of 400 cr due to order spillover to Q1 FY25)
![]() FY25 revenue target remains intact. (500cr)
FY25 revenue target remains intact. (500cr)
![]() OPM will be around 18-20%
OPM will be around 18-20%
![]() Capex will be in the range of 15-20cr over the period of next 18 to 24 months.
Capex will be in the range of 15-20cr over the period of next 18 to 24 months.
Read full Q3 concall insights at: https://twitter.com/Bornwinner_VJ/status/1770825533946790254
Adding on Guatemala Point:
Two points, they were covered on concall: A) Sending Goods from FOB to CIF B) Strategic advantage of Guatemala.
A) & B) being a corporate group we are able to optimize the freight cost and as we are able to pool the goods and our container formatting will happen faster than earlier right and then availability of ship also will be faster and then we will be able to reach the goods earlier to the port. As we have mentioned in the past, we have a warehouse in Guatemala. The other countries can be serviced from there. Once the goods reach to Guatemala some of the countries it goes by road. One country it will go by ship. The El Salvador and for other countries it can go by maximum of two to three days. When we are able to pool the goods for Guatemala, we are able to get earlier consignment, earlier ships availability and then also freight advantage.
What is checking on each quarter and yearly basis?
we are comfortable giving out is that our gross margins are always between 55% to 57% and our EBITDA and PAT and everything have been very similar 35% to 36% and then PAT has always been hovering around the 25%. We are today a global company right in whatever small size we are still; we are still a global company.
So, all our calculation, with this numbers. Keep in our mind and reach to the numbers!!!
Thanks for your mail clarification and taking the pain. I will try to initiate small position here based on fundamentals.
Regards.
Prabhat Ranjan Mohanty
@Mudit.Kushalvardhan I do not know how much returns Motilal Oswal Microcap Index fund has given; my XIRR for over 15 – 16 month is 74.7% as of end March 2024. I have two observations.
Even with just 25 stocks, I find there are several occasions where I have laggards in my pf. With a pf carrying the entire 250 stocks, I am sure they must be holding a lot of low performers.
I do a rebalance every week; in effect, I carry the strongest 25 stocks every week. When a fund is holding all 250 stocks until the next index change, I don’t believe they can be very efficient in terms of returns.
Recent presentation video. Looks good.
Dynamatic Technologies Limited – Analysts & Investors Meeting 23-02-2024
Motilal Oswal Microcap Index Fund has given matching returns as your strategy. How much difference in return we can achieve by taking out 25 stocks out of 250 as per this strategy?