Top 5 Electrical Wire Manufacturers in India – Nov 23 data
Polycab India: 20-22% market share
Havells India: 15-17% market share
Finolex Cables: 12-14% market share
KEI Wires & Cables: 10-12% market share
RR Kabel: 8-10% market share

Top 5 Electrical Wire Manufacturers in India – Nov 23 data
Polycab India: 20-22% market share
Havells India: 15-17% market share
Finolex Cables: 12-14% market share
KEI Wires & Cables: 10-12% market share
RR Kabel: 8-10% market share
Sir, what according to you would be an ideal candidate for channel trading?
In this chart, since it’s consolidating, one could trade the channel (30-40%).
Could you please help me understand if such strategies apply in these stocks or there are other parameters (apart from fundamentally strong stock having good results).
Thanks
Q3 further important updates based on the Chairman call with CNBC TV18
Even JSW is in the fray post deal with MG.
You’re assuming no increase in margins? That’s unlikely. Also how can CAGR be negative if there is growth anyways? Something seems off. Not following Jupiter, but invested in Yatharth so following the space closely.
Compnay Background:-
Jupiter started its first hospital in Thane in the Mumbai Metropolitan Region that is MMR in 2007, the second one was in Pune in 2017 and the third in Indore in late 2020. This is a 96 plus percent subsidiary. Thane and Pune hospitals are both around 375 beds each and were Greenfield projects, while the Indore Hospital was an acquisition that is planned for about 430 beds, but we are currently operating around 231. All our hospitals are full service independent hub hospitals, where we provide all services from childbirth and newborn care to cancer and organ transplantation services. As we speak, we are constructing a 500 bed hospital in Dombivli, which is also in MMR. The land is purchased, all permissions for construction received, the excavation is now complete and we have begun constructing upwards. The project is likely to be operational anywhere between 2 to 3 years from now. The construction is currently in full swing and working as per our scheduled time.
As the stated objective of the IPO, Company mentioned last time, Company have
repaid all our debt obligations and now got annualized finance savings of over Rs. 40 crores. In the previous quarter, Company also completed empanelment with the insurance companies in Indore, and consequently, Company occupancy has increased from 51.2% in the last quarter to 56.2% in Q3 FY24. The contract renegotiations with insurance companies at the Pune Hospital are also concluded and it has been one of the factors that has helped to increase the ARPOBs from ~49,000 in Q2 24 to 53,400 in Q3 FY24.
Personally I have been to their Thane hospital for my mom cardial test, Although charges were slighlty higher but the experinace I had was worth it. From Reception intraction to test. Mom was very well taken care of and my billing experiance was great.
Hospital was very clean and seems luxuries. Overall it was wow experiance for me. Since then i have been following this stock. I visited in Dec 2023.
Industrly Background:-
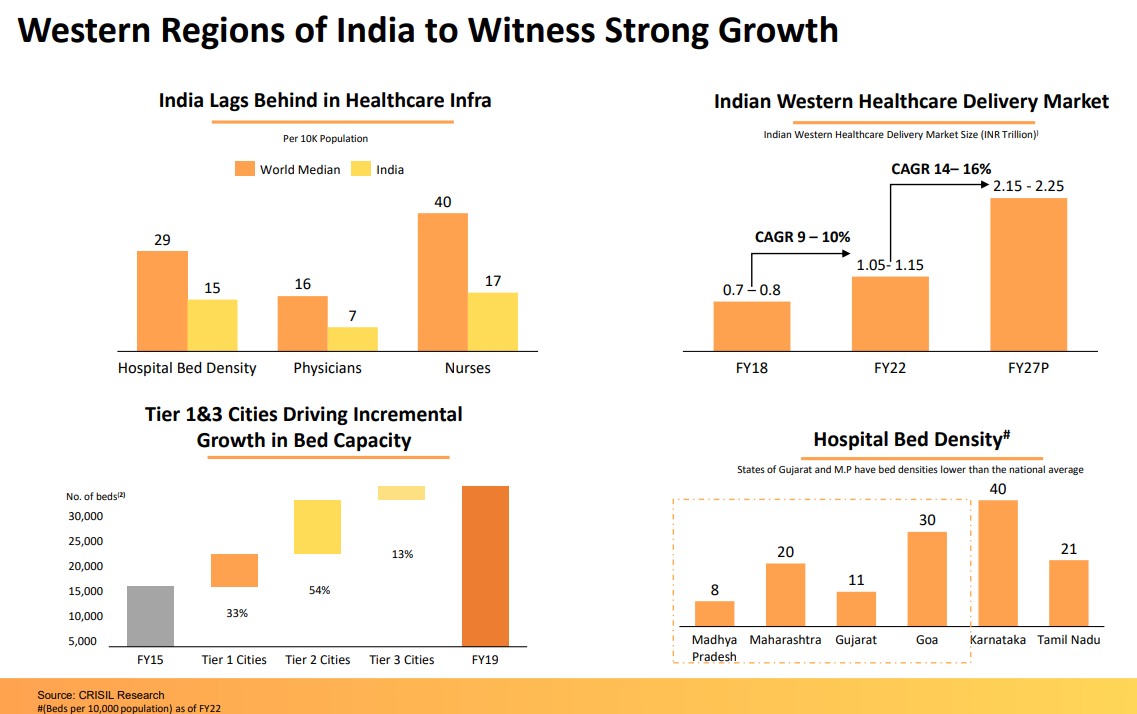
Jupiter life line hospital Q3 update:- Company has posted its highest profit this qtr, partly due to its repayment of debt. Company is walking the talk they said IPO funds will be used to repay its debt and they have done this. Company operate independently on
owned land.The proportion of the Indian population of 60 years or more is expected to rise to 12.5% by 2026 from nearly 8% in 2011
FY24 Nine Months period update : -Fo**r the nine months period, the total income has been Rs. 782.1 crore, 19.8% growth. The EBITDA for nine months is Rs. 178.9 crores, that is a 17.6% increase Y-o-Y. And the EBITDA margin is 22.9%. The PAT for nine months is Rs 131.3 crores. The average occupancy for these 9 months has been 63.2% compared to 60.6% in the previous year same period. ARPOB for 9 months FY24 is Rs 53,585 and the ALOS is 3.92 for these 9 months.
Capex Update:- Company is doing a capex in Dombivali east for 500 beds. Kalyan dombivali region comes under smart city plan of central goverment. Project is very near to Lodha palava city and proposed metro line. Many residensial real estate plans are about to be completed.
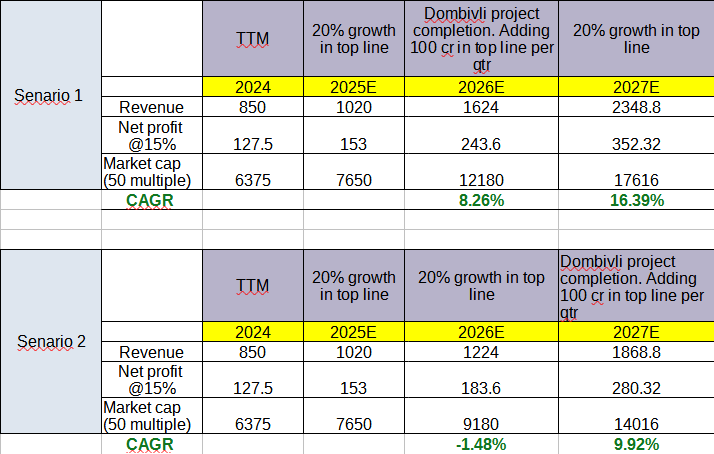
Above image shows 2 senario
Senario 1 – Project completed in FY 2026. Considering 20% growth annualy on existing hospitals and adding 100cr qtrly revenue in top line. (100cr calculation as below 500 beds – 50% occupency – 50000ARR) . With net profit % at 15% 2026 profit would be 243 cr and 2027 350 cr while taking 50 multiples i have come to target market cap.
Senario 2 – Project compeltion in FY 2027. Considering 20% growth annualy on existing hospitals and adding 100cr qtrly revenue in top line in FY 2027. with Annual profit of 280 cr and multiple of 50 market cap would be 14000cr
Risk and threats
With above optimist senario CAGR return which can be make from here seems low and compnay is fairly valued at this price.
Please provide your feedback any feedback will help. Just let me know if you have liked it or dont liked it. where did I went wrong what i have not embeded in this calculation.
Is this right way to analysis company or should I change the way?
Valuation Note 3 – UPDATED [22nd February 2024]
Current Valuations can only be judged from the vantage points of How the future turns out.
If 1 year Down the line PAT growth is 30% or higher, and there is visibility for Robust Orders even beyond that, Current Valuations are approx ~ 20X P/E
If 1 year Down the line PAT Growth is 30% or higher BUT the order book starts to dwindle, the stock will be punished. Fast & Hard.
Therefore, What is cheap or expensive is based on our understanding of the future.
The question then becomes: How confident are we that Order book will remain Robust?
Firstly, Tender Pipeline for Wind/Hybrid projects & Awarded Capacity give us confidence that this most likely will be the case (Thanks to @rcinvestor999 for regularly updating us on the same)
Secondly, the Management Commentary is bullish (Disclaimer: Management has a strong incentive to paint a rosy picture, so this is not always the most reliable Signal)
Given a 75% Market Share in Wind Energy Sector, plus a high % of Cranes with 100 MT and above capacity (most suited for higher Hub heights), Sanghvi is well placed to milk this Wind Energy boom.
The second question then becomes: If Demand is well taken care of for the foreseeable future, what can limit Sanghvi’s Growth?
My 2 cents : Its own capacity.
Even after spending ~400 Cr this year, Sanghvi has an Soft upper limit of ~154 Cr per Quarter of Sales or 615 Cr per year.
In FY24, Its already hitting that number (Q4FY24 Sales should be ~155 Cr),
If despite a huge capex of 400 Cr in FY24, Sales have a limit of ~154 per Quarter, where’s the 30% Growth going to come from?
First Let’s Checkout Rental Yields :
| Rental Yield (%) | 2.3% | 2.5% |
|---|---|---|
| Sales (Cr) | 646 | 702 |
**Assuming Current Gross Block of 2600 with 90% Max utilisation. Sales = 0.9*Gross Block Rental Yield
If Rental yield increases to 2.5%, Sanghvi can eke out as much as ~700 Cr. Nearly 80 cr more.
So, the same Crane Capacity can accommodate at least up to ~11% Sales Growth without spending more on increasing crane capacity (i.e – buying more cranes)
But there’s the kicker, an increase in Rental Yields to 2.5% goes straight to the bottom line.
This 80 Cr, on a post-tax (25%) basis, has the potential to increase PAT from 180 to 240 Cr.
A 30% PAT Growth.
Although the probability of Sanghvi hitting a Rental yield of ~2.5% should be viewed with a healthy Skepticism, it is NOT entirely outside the realm of possibility.
The Second driver is capex.
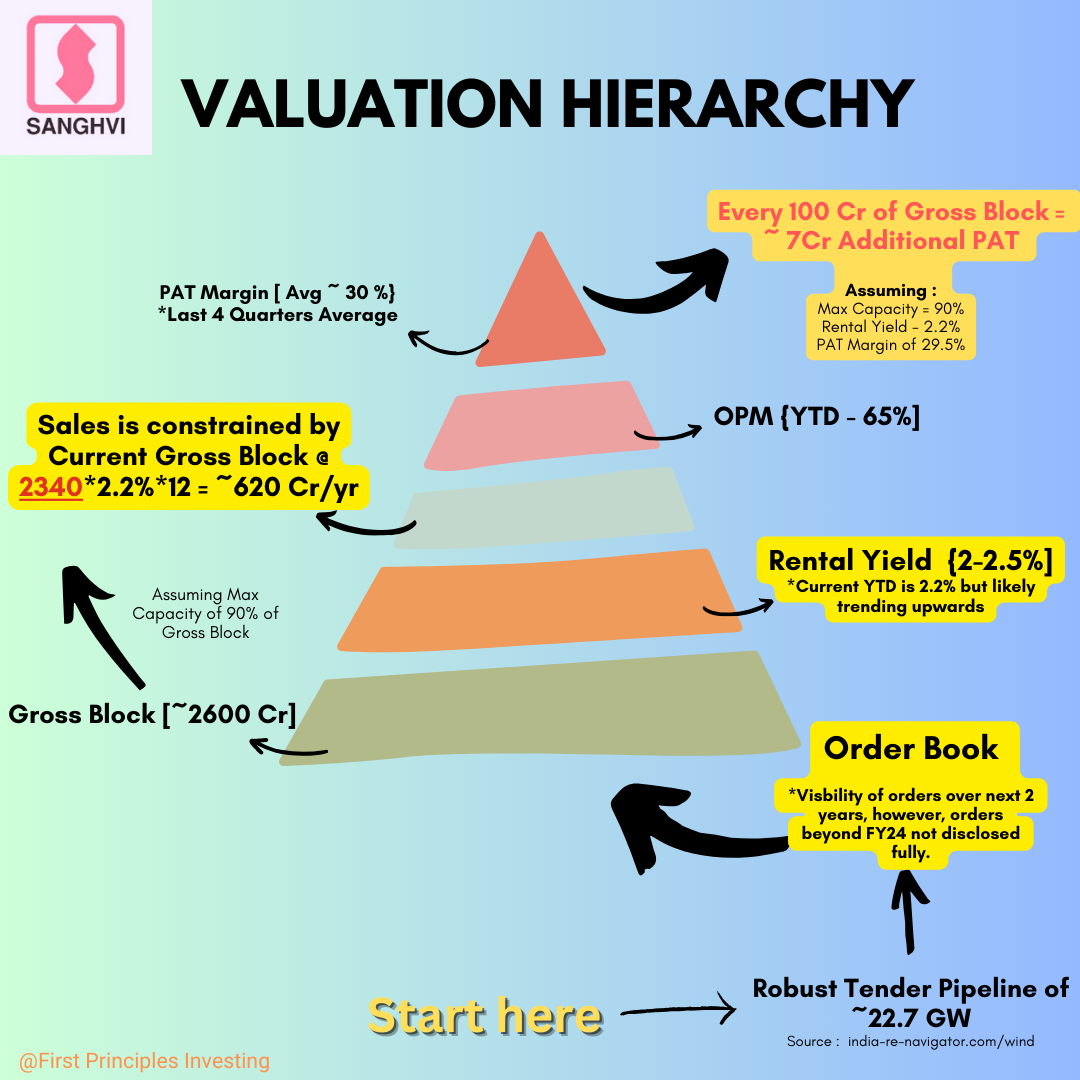
From the Graphic below, we can see that Every 100 Cr spent on Capex can increase PAT by ~ 7 Cr assuming Rental Yields & Net Margins at 2.2% & 30% respectively.
This means if the co’ spends another 400 Cr, PAT Growth is likely to be just about 15% (28/180 Cr)
Hardly inspiring. If viewed in silos.
The 3rd Driver is is the outstanding EPC Order book of ~111 Cr to be executed ~ 71 cr in FY25 and remaining 40 Cr in FY26.
I have no clue what the PAT Margins for EPC book can look like (@rajdori, @Vaibhav_Temani – Any reliable sources?) but 25% PAT for EPC may seem a little too optimistic. I also have no clue as to the distribution of the EPC order book. Whether Co’ will recognise this 71 Cr equally per Quarter in FY25 or any other way.
A conservative 10-15% PAT Margin, would lead to a PAT of 7-11 Cr in FY25, which is a 4-7% Growth over FY24 full year PAT of ~180 Cr.
Bottomline is that there are 3 Growth Drivers, all of which rest on the foundation that Order book will NOT be an issue.
- Rental Yields increasing
- A Sizeable Capex Program to Increase Capacity
- EPC Book (111 Cr) & potentially Growing further.
If this basic premise fails for whatever reason, these 3 Key Drivers will be significantly weakened.
Growth (if) is likely to be a function of a combination of the 3, with Rental Yields being the most preferable (Increases ROE too) and Capex being the least preferable way to pursue growth.
In Conclusion, Current P/E of 28-29X are justifiable only if PAT Growth is strong. For me, a 30% growth in PAT is a minimum benchmark for valuations to make sense. Maybe for you its a different number.
Thanks again @aditya_kedia, @rajdori & @Vaibhav_Temani for your valuable inputs.
Look forward to hearing your views. Please Feel Free to point out any errors.
As ETHOS is hitting new high and at 85 PE. KDDL is consolidating and available at 35 PE. We understand there is discount of holding company. However, KDDL has his own business of watch dials/hands etc.
Any thing I miss, why KDDL is not moving?
D: Invested
Hi @DeveshKedia,
Coincidentally, I had planned to start a thread on SAMHI today.
Glad that you have covered it comprehensively.
I like the Sam Zell approach followed by SAMHI of buying distressed hotels and turning it around using rightsizing and rebranding. While their distinct strategy of targeting areas where airport and office space are nearby leads to steady occupancy and room rents driven by corporate demand.
I think an asset heavy capex is critical when buying distressed assets, however, if mgt can create a track record of monetising the assets using sale and leaseback once they are turned around, that will be a major driver for re-rating.
Given the differentiated business model, the only comparable peer is Chalet Hotels which trades at TTM EV/EBITDA of 35x while SAMHI trades at 22x. Notably, SAMHI is expected to report 35% EBITDA CAGR over FY23-26 vs 24% for Chalet.
Disclosure: Invested since IPO, added post 3Q24 results as well.