Thanks for the insights.
Its a bit strange that the promoter holding has significantly changed and I can’t find any disclosures regarding this as to when and why did it happen.

Thanks for the insights.
Its a bit strange that the promoter holding has significantly changed and I can’t find any disclosures regarding this as to when and why did it happen.
Diary number 31185 and 38828 year 2023, both next hearing on 06/11/2024.
Tareek pe tareek. ![]()
Regarding compliances we have a CA firm who exactly know at what stage what compliance will kick in . They are helping us . So that is not a worry . As regarding some models, backtesting and forward tests and all , we dont believe in all those . We are old school guys reading annual reports, concalls , going on ground to talk to some players in that sector , looking at traditional financial and valuation metrics
We will do pure fundamental based investing because we only know that
Learnt a lot from Ishmohit, however I have different views, Below is the same I posted in response from his twit.
They just said they may meet at the lower end of guidance, that is 18% growth and in the same tone they said they will be able to improve margin slightly. The picture is presented as they won’t grow. How many ER&D co may grow at 18%?
I think the primary reason is valuation. On 10th October, it was trading at 45 times PE multiple. Now the valuation is is in more reasonable 27-28 times. That is not to say that it cannot fall further. In general FMCG space is falling a bit more than market. Many of the more established players in FMCG market has fallen quite a bit, much more than index. In such a market micro caps stocks do fall more.
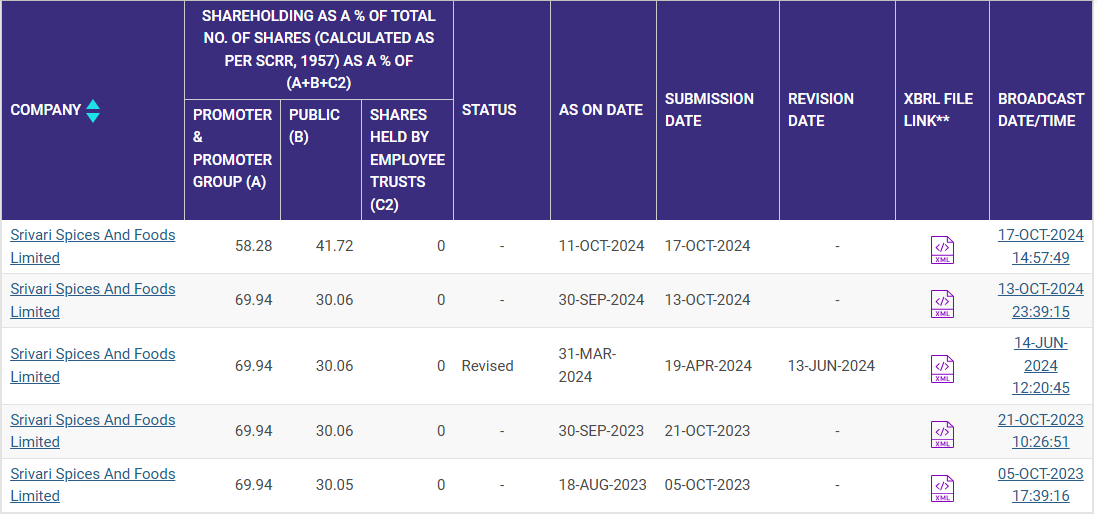
Looking at the company, there is no negative news about the company; however even the positives are missing. There has been no announcements about entry into oil and other products they planned. Further, the shareholding of management has come down in October fling, from 69.94% to 58.28%. Further, shareholding of one Avneesh Rana has gone down.
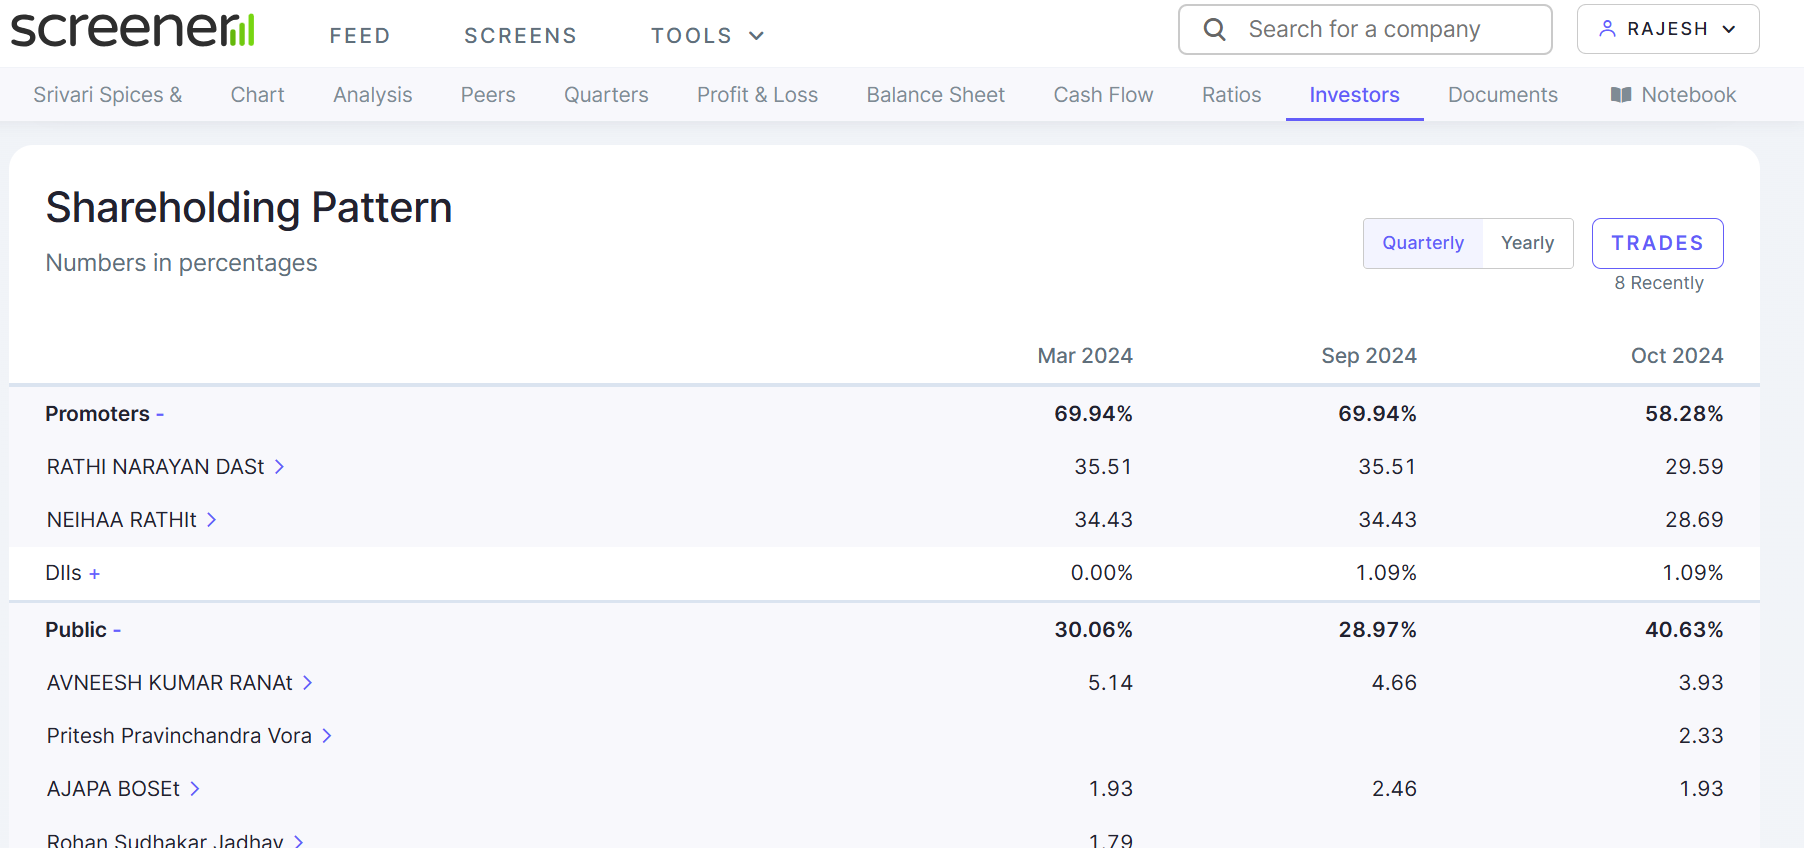
There is no news of promoters selling anything in market or any notice on exchanges. I think promoters should explain this.
On positive side, the company is expected to do well in H1. Further, the company has received around 25 Crores in rights issue. It should give financial strength to the company to grow at the projected rate. Even the management participated fully in the rights issue at Rs. 175 per share, as declared by management earlier. Thus, things are not looking that bad.
Yes, as an investor we don’t know everything, we cant know everything. Investing is all about taking bets in uncertain future.
@gautamashukla There are two videos that I had posted previously. You can find them around the 250th message in a thread called “Smallcap Momentum Portfolio”. That will explain the strategy and how the sheet is used.
What’s causing this stock to bleed so much ?
Although I am negatively biased from day one, just curious to understand if there was any insider news?
Finacial Results for the second quarter and half year ended 30th September 2024

Indeed. May be due to delay in capacity expansion. Nevertheless, now capacity is expanded to 7500 MVA and running. OPM have increased and likely to sustain or might go up a little due to operating leverage and exports. I think they can still do 625 crores around. Assuming 11 lakh per MVA (may go up further in exports), they can do around 400 crores in H2 in case of full capacity utilisation. 237 already in H1 and not to forget this is H2 heavy business. Waiting for concall for more clarity.