
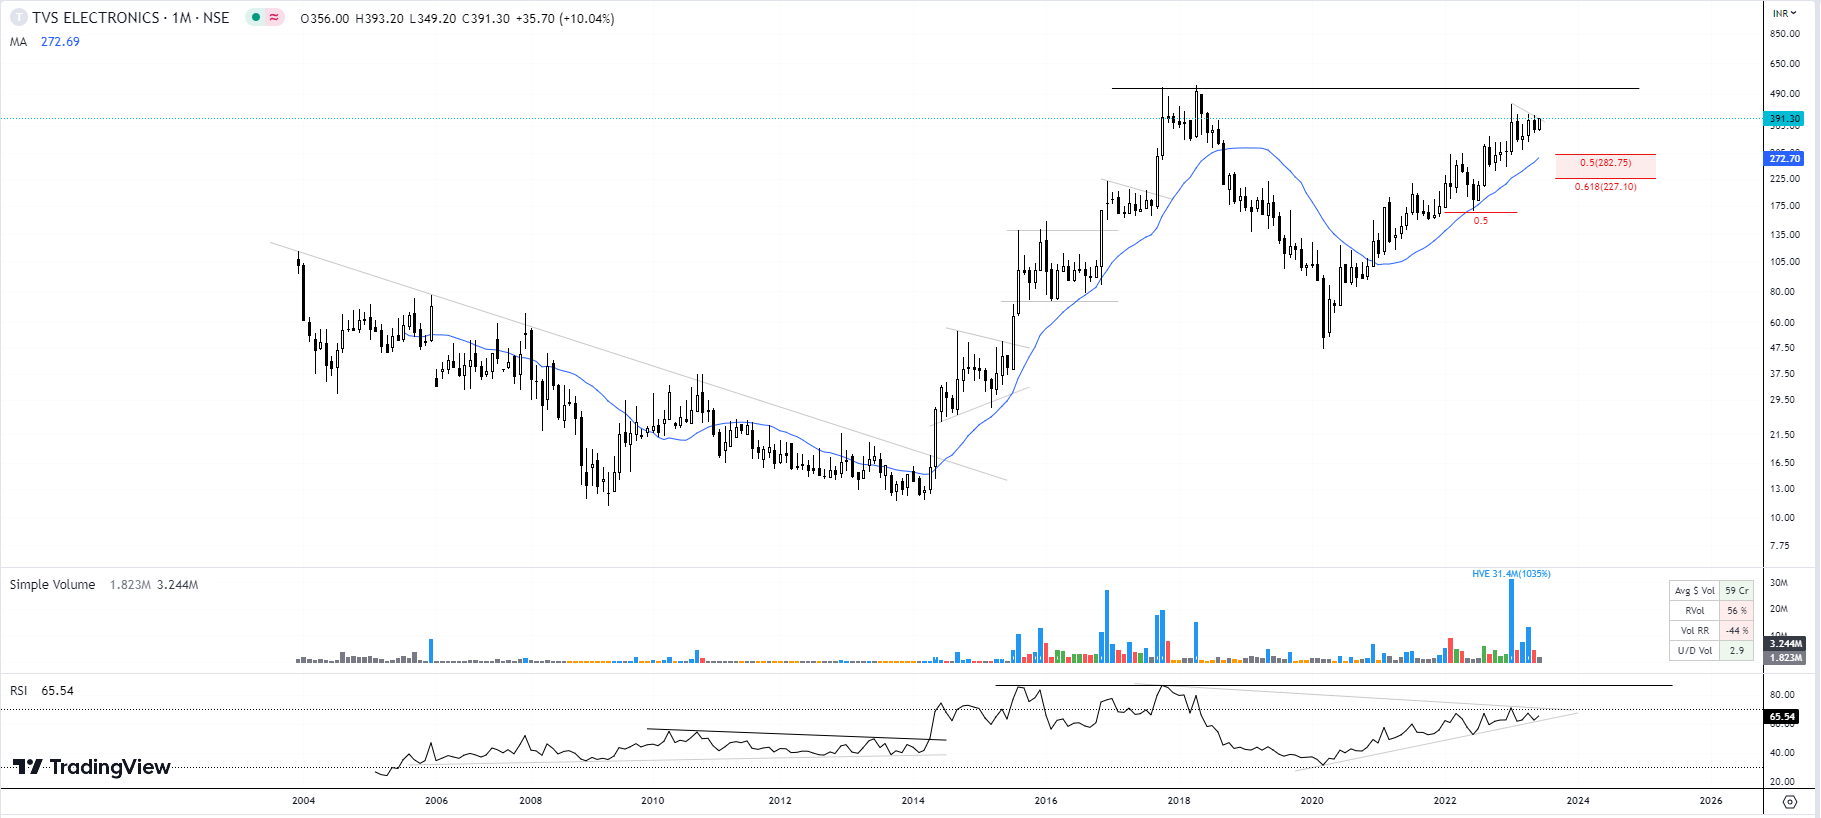
A Monthly chart that i am finding interesting is that of TVS Electronics:
- The stock gave a multi year slant breakout in May 2014 at ~ 18 odd levels.
- The rally continued till it topped out in Oct 2017 at with a high of ~ 520.
- What is interesting is that one could have played the entire rally if one kept the 20 month moving average as a trailing stop loss.
- Multiple patterns formed and broke out along the way, while still touching and respecting the 20 month MA.
- Since topping out in 2017, the stock now seems to be forming an excellent CUP base over the last 6 years.
- The 20 month MA has been respected in the upmove from Covid lows as well.
- The RSI also seems to be shaping up well and could lead to a break out.
Possibilities could be a straight breakout from the CUP base pattern or formation of a handle ( key monitorable will be retracement of 0.5-0.618 levels if a handle does form).
All in all, looking like a good setup for a bullish run in the future.
| Subscribe To Our Free Newsletter |
